There is a lot of confusion in understanding imprisonment data created by the failure to understand the difference between the characteristics of people sitting in prison at any one time (what are technically called the “stock”) and the characteristics of the people who have gone though prison (the flow). This is especially important for understanding debates about the offense mix of people sitting in prison versus the offense mix of people who are sent to prison. The short version is that a snapshot of those sitting in prison at any one time has a larger share of people who have very long sentences for very serious crimes, while the flow of people through prison has a higher proportion of people given short sentences for less-serious crimes.
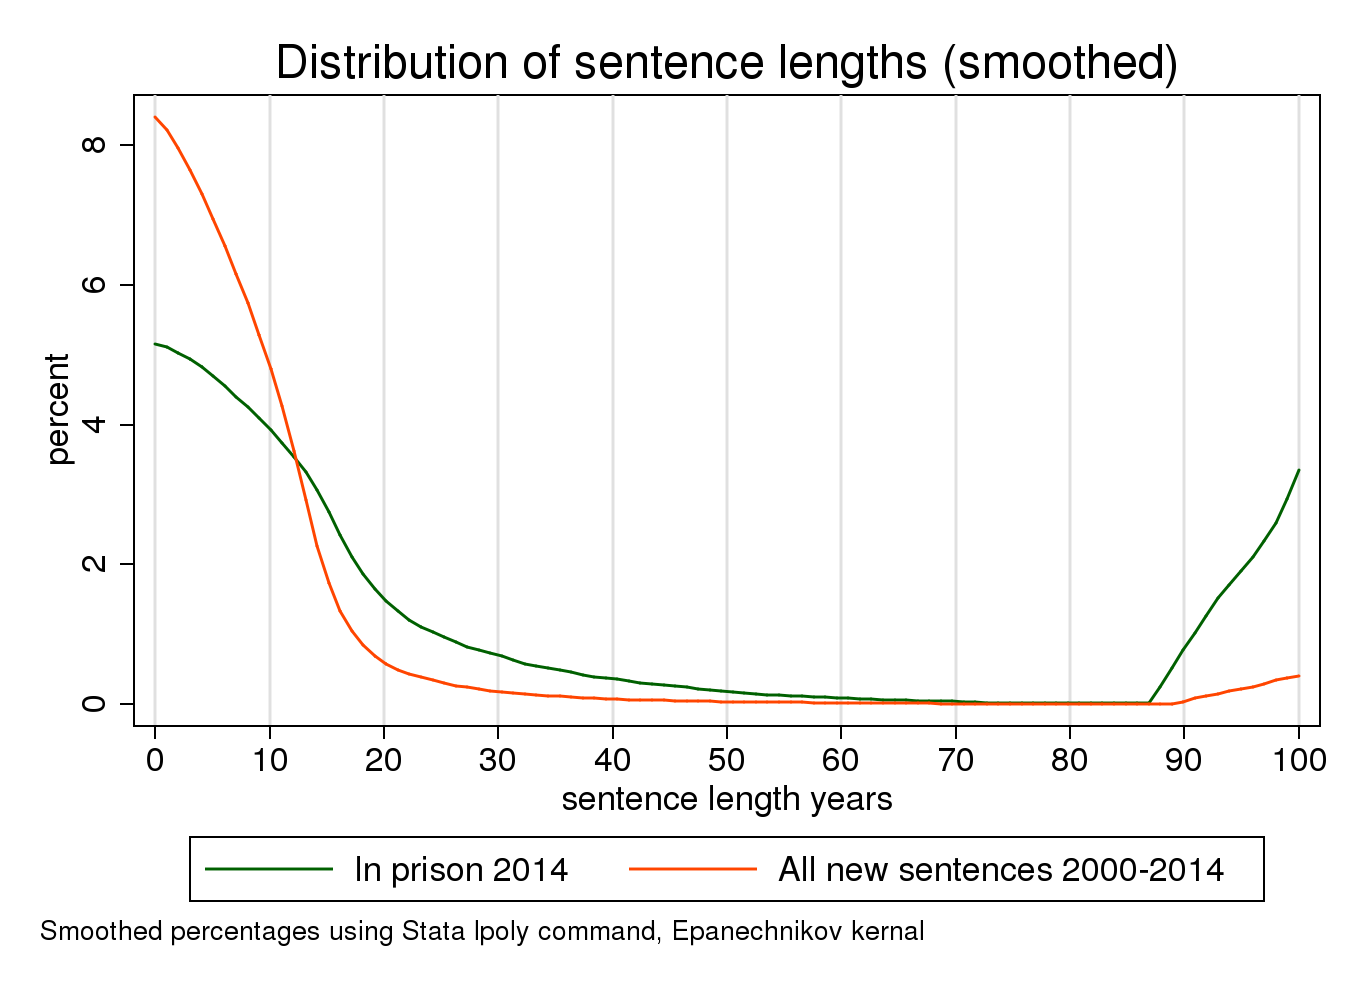
I addressed this issue one way in my “length of stay” post. Another way to view this issue is by examining the sentence lengths of people in prison versus the people sentenced to prison. Sentences are imposed by months. The graphs in this post provide a smoothed representation of this information. The first graph compares the distribution of the sentence lengths for people in Wisconsin prison in 2014 (the stock) versus the sentence lengths for everyone sentenced to prison in Wisconsin 2000-2014 (the flow). About 10% of the people in prison are there for life while less than 1% of the people ever sentenced to prison received life sentences. Many people are sentenced to prison for short sentences of less than 18 months but they come and go quickly and so account for a smaller proportion of the total in prison at any one time.

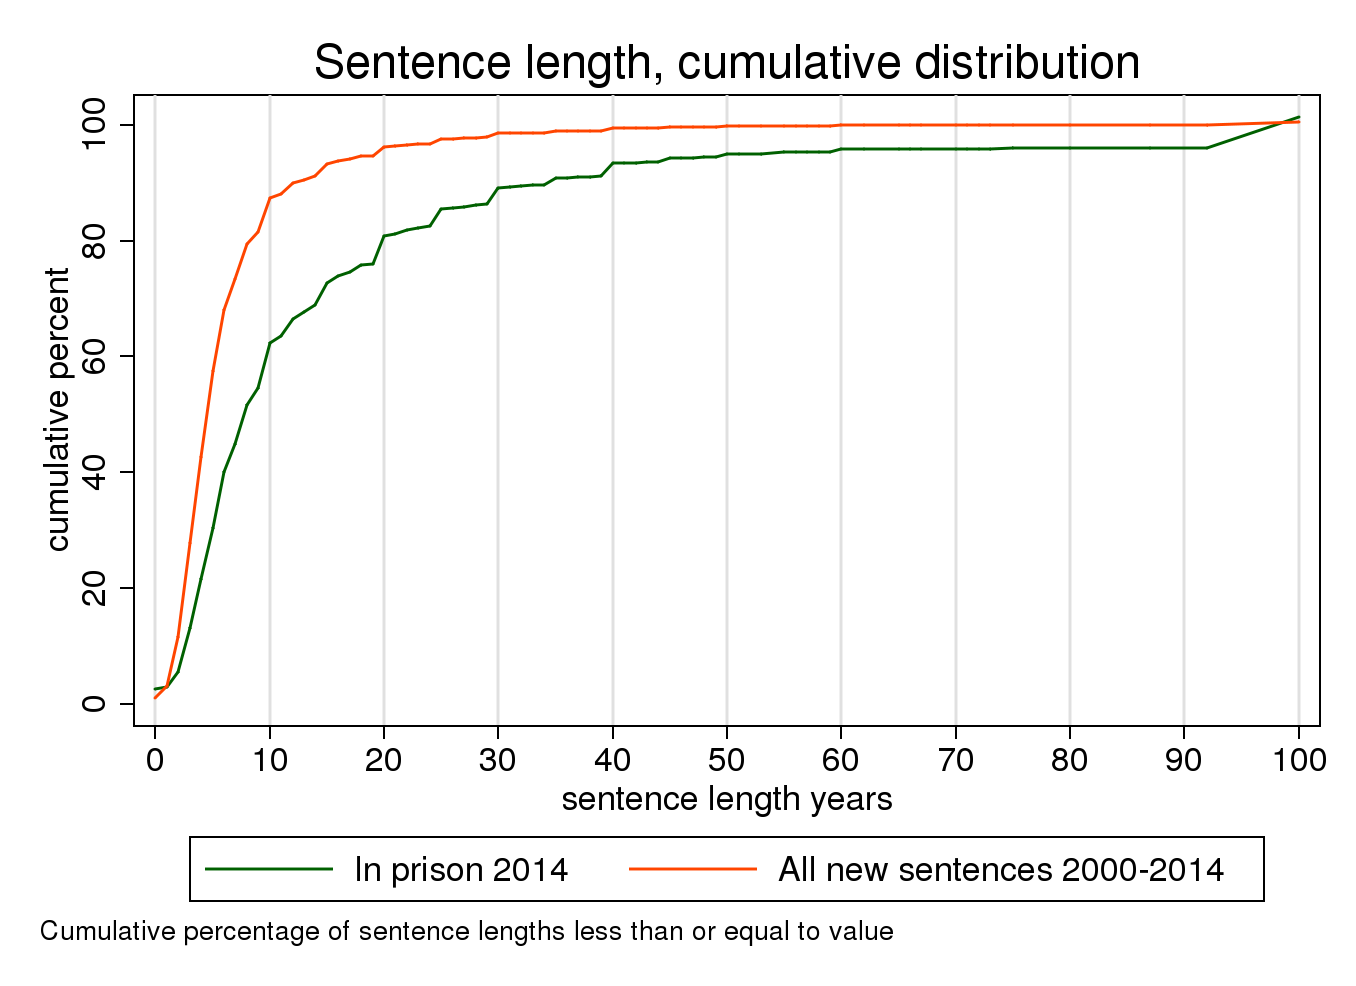
Here is another way of presenting the same data, as a cumulative distribution. The steps appear in this distribution because sentences longer than 3 years tend to be multiples of 5 years. Nearly 90% of prison sentences are for less than 10 years, about half for less than 5 years, but only 60% of the people in prison in 2014 had sentences of 10 years or less and only 40% had sentences of 5 years or less.
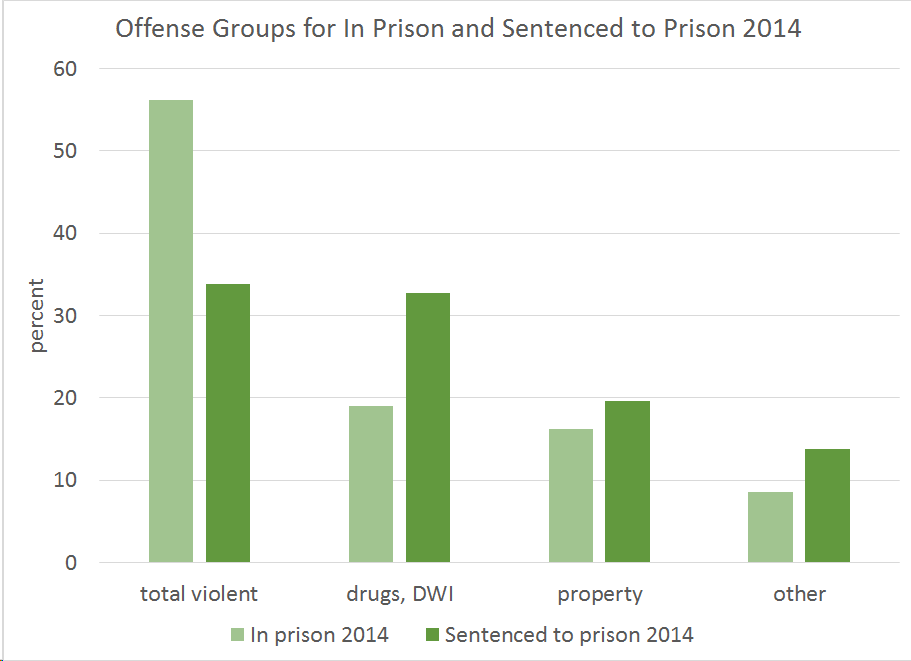
This is why you have to ask whether you are discussing the proportions in prison or the proportions sentenced to prison when you talk about offense mix. As quick example, well over half of the people sitting in Wisconsin’s state prisons in 2014 were convicted of what the BJS classifies as a violent offense, but only a third of the people who entered prison with a new sentence that year were convicted of a violent offense. Those sentenced to prison were more likely than those in prison to be drug or alcohol (DWI) offenders, or convicted of other nonviolent crimes.

Data and notes
Data source is National Corrections Reporting Program restricted data file 36373 available from ICPSR. These data are restricted; you have to obtain IRB approval and file a confidentiality plan with ICPSR to use them. The data come from state departments of corrections, so the original source of the data is what the Wisconsin DOC deposited with the NCRP. I exclude records in which a person has the same prison entry and exit dates in a record, as these typically mark transfers or shifts in custody status rather than true entries into and exits from prison. Sentence length is the TOTAL_SENTENCE variable, which is expressed in months, with a special code for life sentences. All sentences longer than 1200 months (1000 years) plus all life sentences are recoded to 100. “In prison 2014” includes anyone who was still in prison at the end of 2014. “Sentenced to prison in 2014” includes everyone who entered prison with the admission category “new conviction,” “probation revocation” (with or without new sentence), or parole or mandatory release revocation with new sentence.
A comparable analysis may be performed with the public version of these data, ICPSR file 35404. Those data have only two relevant prison admission categories in ADMTYPE: new conviction, which also includes all probation revocations (with and without new sentences), and parole revocation, which does not distinguish between revocations with and without new sentences. The sentence length variable in that file is SENTLGTH.


One comment