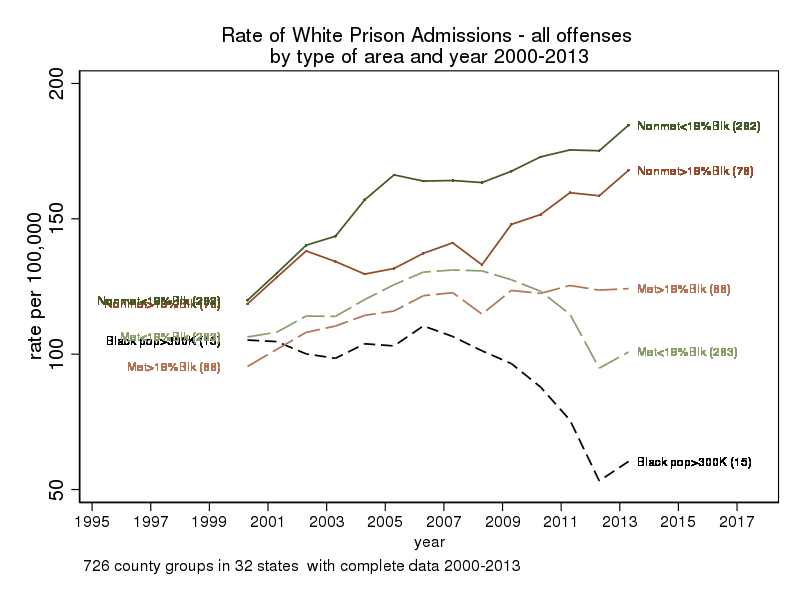
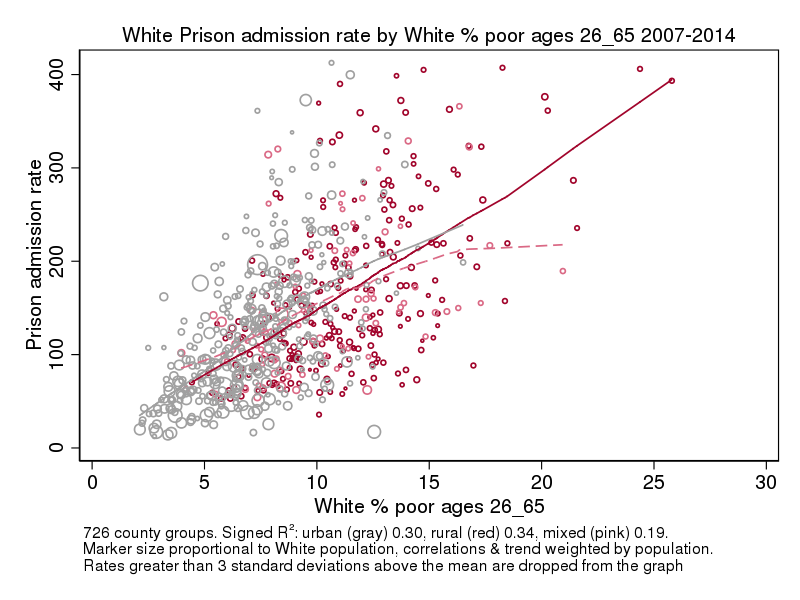
In a previous post, I showed how the White imprisonment rate rose in rural counties even as the Black and White imprisonment rates in metropolitan areas fell. In this post, I show that the White rural-urban difference in imprisonment is linked to the White rural-urban difference in poverty and education,
Read moreWhite rural imprisonment rates
Unremarked until very recently* , there is a hidden story to be told about the rise in White incarceration in the United States to supplement the story about the mass incarceration of Black people I and many others have been writing about for years. The White story has been going
Read moreClock restarting and Wisconsin’s Revocation Problem
A quirk in Wisconsin’s Truth in Sentencing law increases the “churning” in and out of prison via revocation and creates the possibility for massive injustice & increases costs.[i] A Wisconsin sentence has a total length that is divided into two parts, imprisonment and extended supervision in the community. If a
Read moreOffense, Admission Types, In Prison Vs. Admitted
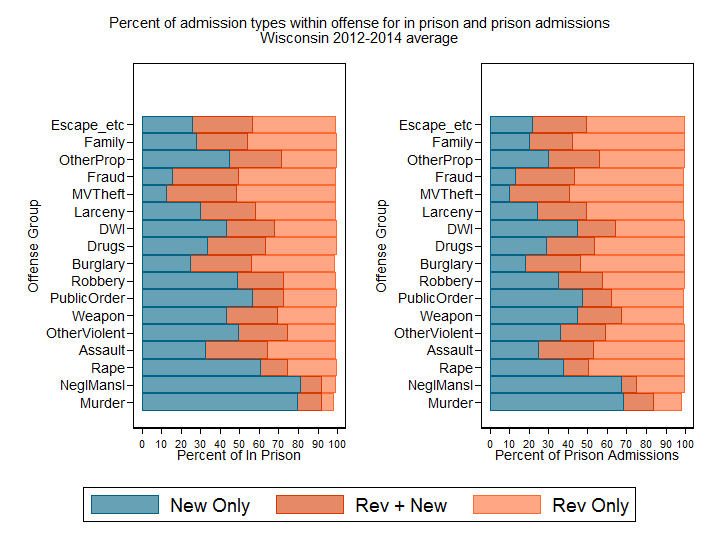
I’ve written several posts trying to clarify the reasons you will get a different mix of offenders in a snapshot of who is in prison versus the flow of prison admissions. This also comes up as we compare the combination of offense type and admission type. To illustrate this,
Read moreWisconsin Imprisonment Trends By Offense
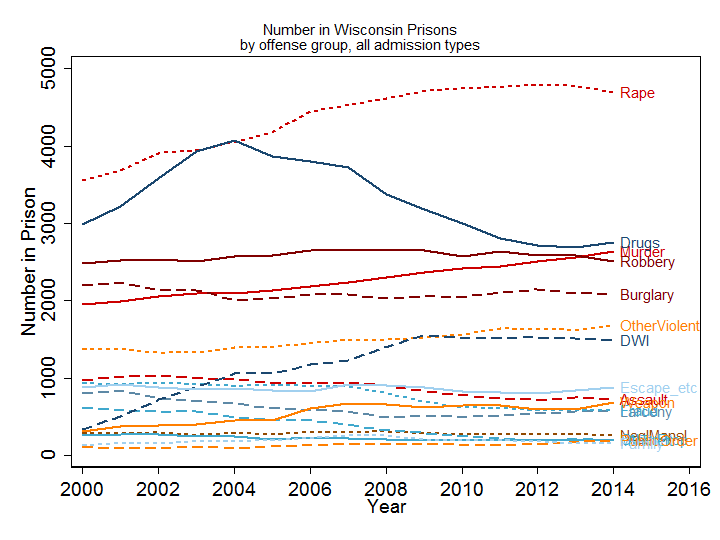
A reporter’s inquiry led me to look into the changing mix of offenses among people in Wisconsin’s prisons 2000-2014. This is a short version of a longer report about what what I found. A report in the Wisconsin Taxpayer Magazine provides a substantial amount of analysis, including summaries of important policies
Read moreHow long do people stay in prison in Wisconsin?
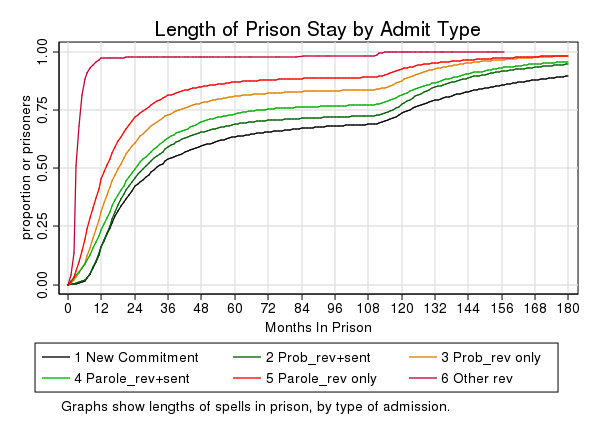
It is important to understand how long people stay in prison as part of understanding revocations. The graph below shows how long people stay in prison across all admission types. The vertical axis shows the cumulative percentage who have exited after the number of months on the horizontal axis. So,
Read moreComparing Wisconsin Counties on the Black/White Disparity Prison Admissions
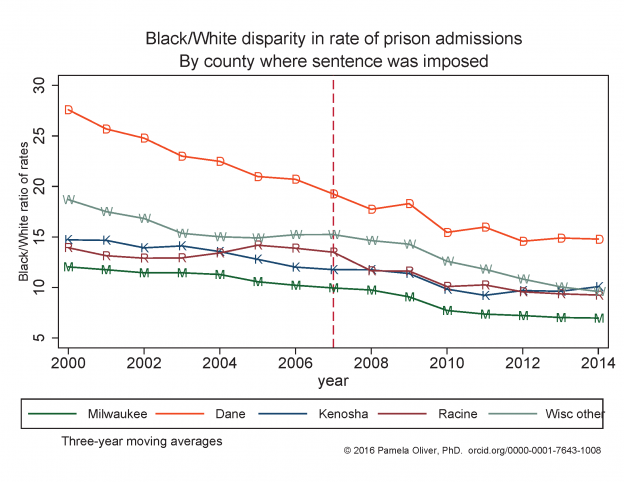
Dane County has the highest Black/White rate of prison admissions among Wisconsin counties with large Black populations, but it does NOT have the highest Black prison admission rate. That dubious honor goes to Kenosha County. Milwaukee County has high racial disparities in prison admissions and has over 70% of the
Read moreMilwaukee County Prison Admissions by Offense 2000-2014
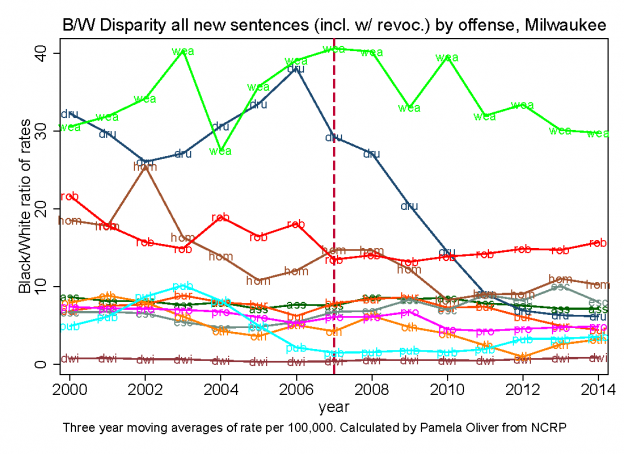
These graphs are calculated from the restricted files of the National Corrections Reporting Program. They show the rate of admissions to prison for new sentences by offense group separately for Blacks, Whites and the Black/White disparity. A chart for the offense codes is between the Black and White graphs. They
Read moreState prison incarceration rates 1978-2007
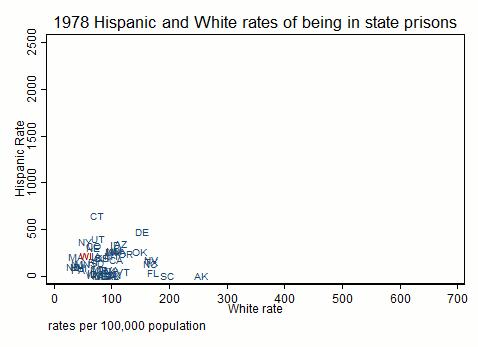
UPDATE: CLICK HERE TO SEE THESE FIGURES FOR 1978-2013 in a later post These graphs allow you to see the growth of state imprisonment 1978-2007, by race. I will have updated and error-checked data for 1978-2013 soon. Because I live in Wisconsin, I flagged the Wisconsin rates. These update at
Read moreRace, Mass Incarceration, and Bill Clinton’s Policies
Did Bill Clinton’s policies cause the mass incarceration of Black people? Since I’ve done a lot of analysis of incarceration trends in the 1990s, I thought I’d bring some facts into this discussion. Short version: The steep increase in the mass incarceration of Black people happened before Bill Clinton took
Read more