Racial Disparities in Criminal Justice
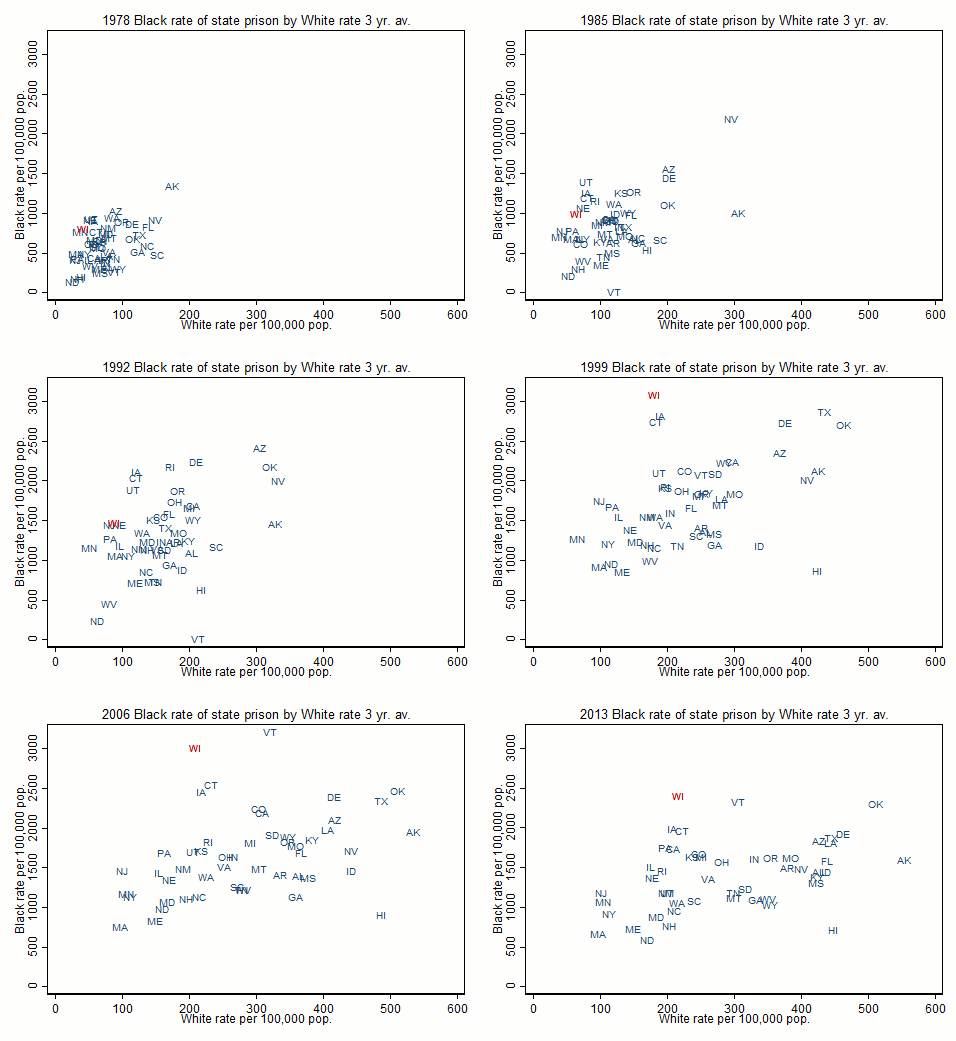
Wisconsin has one of the highest Black imprisonment rates in the US. Using a variety of sources, I developed detailed descriptive information about racial patterns of incarceration and arrest in Wisconsin and the United States. This animated graph shows how Black and White state imprisonment rates changed over time. I highlight Wisconsin, which began the series having a relatively low incarceration rate for both races but in the 1990s raced to the top for Black incarceration. It remained at the top of the distribution of Black rates even as the overall distribution fell.
You can see more animated graphs for Hispanics, Asians, and American Indians by clicking here.

