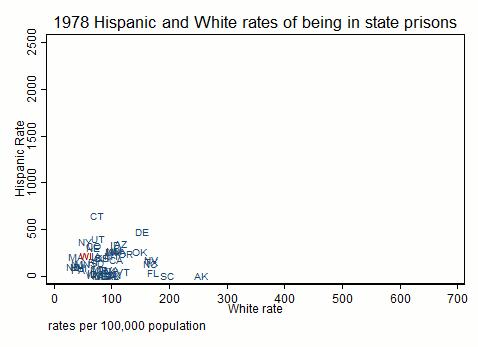
UPDATE: CLICK HERE TO SEE THESE FIGURES FOR 1978-2013 in a later post These graphs allow you to see the growth of state imprisonment 1978-2007, by race. I will have updated and error-checked data for 1978-2013 soon. Because I live in Wisconsin, I flagged the Wisconsin rates. These update at
Read more
