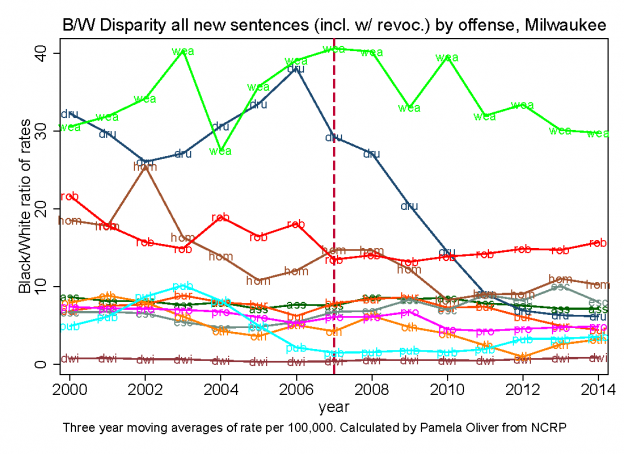
These graphs are calculated from the restricted files of the National Corrections Reporting Program. They show the rate of admissions to prison for new sentences by offense group separately for Blacks, Whites and the Black/White disparity. A chart for the offense codes is between the Black and White graphs. They
Read more
