Stata for Students: Using Stata
Stata is a popular statistical program at the SSCC that is used both for research and for teaching statistics. Stata for Students is focused on the latter and is intended for students taking classes that use Stata. Those who plan on doing research with Stata should read the more rigorous introduction found in Stata for Researchers.
Stata for Students has two parts: Using Stata and Basic Statistics, Regression and Graphs. You may want to read Using Stata at the beginning of the semester and then read Basic Statistics, Regression and Graphs as your class covers its topics.
Using Stata includes the following sections:
If your class will only be working with data sets that are provided to you in Stata format you can skip the section on Getting Data Into Stata.
Accessing Stata
The SSCC makes Stata available both in our computer labs (4218 and 3218 Sewell Social Sciences Building) and remotely using Winstat, the SSCC's Windows Terminal Server farm. For more information about lab accounts, the labs, Winstat and more see Information for SSCC Instructional Lab Users.
To run Stata, log in and click Start, All Programs, Stata 14, and then StataMP 14. StataMP4 is for long, computationally-intensive jobs of a kind you will probably not see in class work.
Stata Windows
Stata's main window is built up of several subwindows, each with a particular task, plus a menu bar at the top:
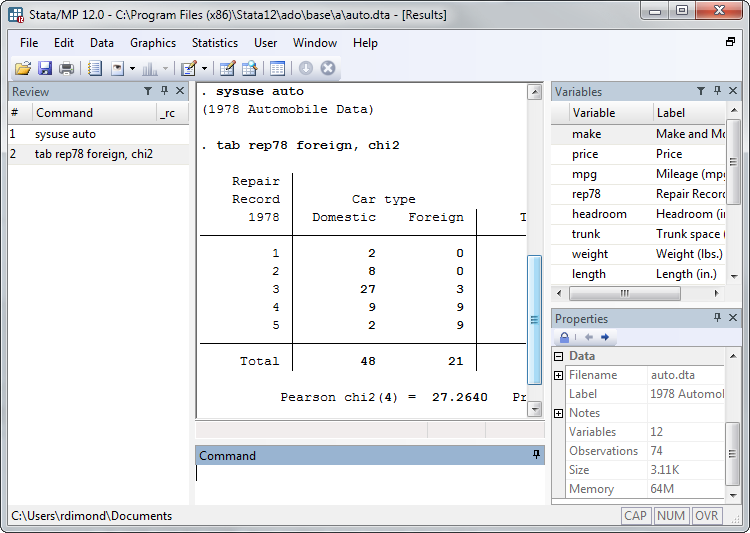 |
To tell Stata what you want to do you'll either click on an item in the menu bar at the top, or type a command in the Command window at the bottom. The menus make it easy to see all your options, but if you know the command for what you want to do typing it will be much faster. Note that you can recall previous commands by pressing the Page Up key.
When you tell Stata to do something, the command itself and its results will appear in the Results window in the middle. If you used the menus, Stata will use what you clicked on to craft the appropriate command and put it in the Results window as well--paying attention to the commands Stata puts together for you will quickly teach you how to type them yourself. If the Results window fills up you'll have to press a key to continue. You can interrupt a command by pressing the q key or by clicking on the button with an X in it on the menu bar--it turns red when a command is in the process of being run.
The command you gave will also appear in the Review window on the left. You can click once on a command in the Review window to put it back in the Command window (usually for editing) or double-click on it to execute it again as-is.
The Variables window in the top right lists all the variables in the data set you're working with. This includes the variable name, its label and other information. If you click on a variable, it will be inserted into the command you're typing. The Properties window in the bottom right gives you information about either a particular variable or your entire data set.
Stata Files
Stata data files have the extension .dta and you can open one by clicking File, Open or by typing use file. If the file name or the name of a folder it's in contain spaces, you must put the whole thing in quotes: use "file with spaces". You can then save a data set by clicking File, Save or typing save file. However, note that when you click File, Save you are not saving the commands you ran or their results, just the data set itself.
Stata comes with a sample data set of cars from 1978 which we'll use in the examples in this article. Open it by clicking File, Open, the C: drive, Program Files (x86), (or just Program Files on some computers) then Stata14 and finally double-click auto.dta. Alternatively you can type:
use "C:\Program Files (x86)\Stata12\auto"
or
use "C:\Program Files\Stata12\auto"
or, if you run into problems with these commands, just:
sysuse auto
For real work you'll typically put your data sets on the U: drive (your home directory).
A log file (.log) is a record of both the commands you ran and the results you got from them. You can start a log by clicking the log button (the one that looks like a notebook) or by clicking File, Log, Begin. You'll then choose a name and location for the log file. We suggest you change the log type from .smcl (Stata Markup and Control Language) to .log so that the log is written in plain text and can be read by any text editor. Once you've begun a log, everything that appears in the Results window is also written in your log file. You can stop logging by clicking the log button again, or by clicking File, Log, Close. We highly recommend that you keep a log of everything you do, so start one as soon as you start Stata.
A Stata do file (.do) is a file containing Stata commands. For research work, it's highly recommended that you put your commands in a do file so you can change, correct or re-run them at will--but if you're interested in such things switch to Stata for Researchers. However, if you right-click in the Review window you can save the commands you've typed as a do file. This generally does not result in a do file you can actually run (it will stop the first time it finds an error) but it can be a very useful reminder of what you've done. To save your commands, right-click in the Review window, click Save All and choose a name and location for the file. You can then open it using Stata's Do File Editor (the button at the top that looks like a pencil writing on a piece of paper).
For simple tasks (or if you forgot to open a log file before doing something) you can copy text directly from the Results window and paste it into Word or a text editor. That may be all you need to do for most of your homework assignments. To do so, select the area you want to copy with the mouse, right-click, and choose either Copy Text or Copy as Picture. Copy Text allows you to reformat or otherwise edit the results once you've put them in Word, but the initial results may be fairly ugly and need some cleaning up. Changing the font in Word to a monospace font like Courier New will often make your Stata output presentable. Copy as Picture puts the results into Word exactly as you see them in Stata, but does not allow you to make any further changes.
Data
To see your data set in a spreadsheet-like format, open the Data Editor or Data Browser either by clicking on their buttons in the menu bar (the ones with a grid and either a pencil for editing or a magnifying glass for browsing) or by typing edit or browse.
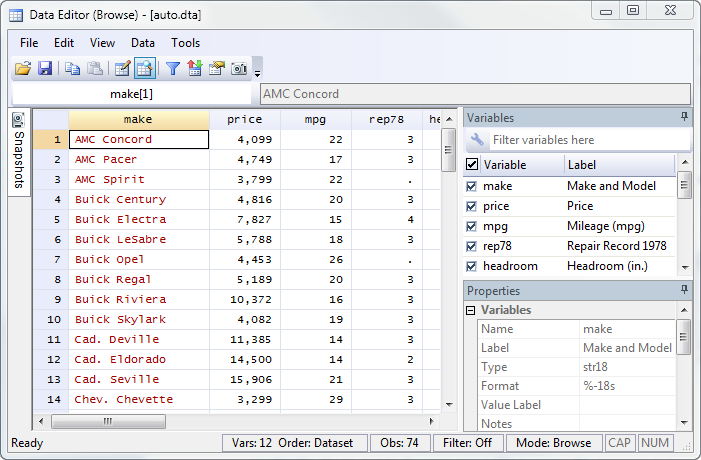 |
The Browser and Editor are essentially the same, but the Editor will allow you to make changes to the data and the Browser will not. If you don't intend to make any changes it's best to use the Browser so you don't change things by accident.
Observations
A Stata data set consists of observations (rows), variables (columns) and values (cells). While all the observations in a given data set should represent more or less the same thing, the meaning of "observation" can vary widely between data sets and it's important to keep track of what it means in yours.
Sometimes the differences can be subtle. Suppose you tracked a group of people for a year, and every month you asked them their employment status. One way to store that data would be to make an observation for each person and a employment variable for each month (employment1, employment2, employment3, etc.) But you could also make twelve observations for each person, one for each month, and then have a single employment variable. (You'd also need a month variable to keep track of which month the observation represents.) In the first structure an observation is a person, but in the second an observation is a person/month combination.
Variables
While there are many different kinds of variables, they all fall into the basic categories of numbers and text, or as Stata calls them, "strings." Strings are strings of characters, and can contain names or other textual information. However, you can't do any kind of math with a string variable--even if the characters making up the string happen to be numbers! To Stata, the value 1 and the character "1" are completely different things. For example, 1+1 is 2, but "1" + "1" is "11". Note the quotation marks: whenever you talk about string variables the values need to go in quotation marks.
It's a common mistake when importing data to accidentally make Stata think a numeric variable is a string. The values of string variables are red in the data browser (like make in this data set) so if you start seeing red where you shouldn't you know you've got a problem. (To find out how to avoid this problem, see Entering Data by Hand.)
Value Labels
In this data set, the variable foreign appears to be a string with the values Domestic and Foreign. But note that it's in blue rather than red, and that at the top of the browser window it lists the value of foreign for the first observation as 0.
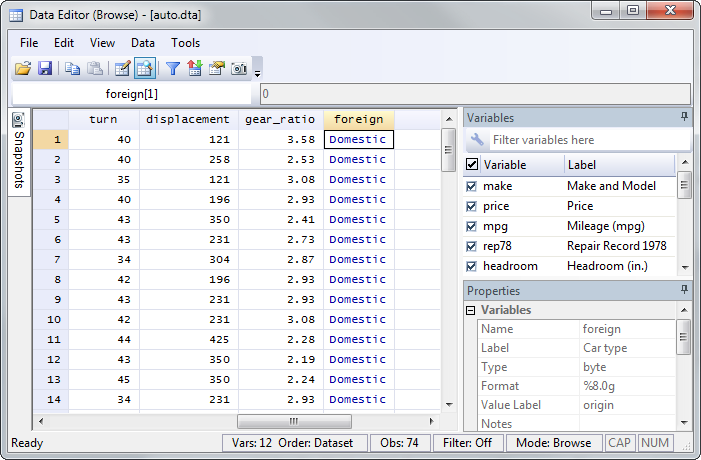 |
In reality, foreign is a numeric variable with the values 0 and 1. However, a value label has been defined which says that for the variable foreign, 0 means Domestic and 1 means Foreign. Thus those words appear in the data browser, and in results rather than the numbers. On the other hand you need to refer to the numbers in commands, not the labels. For example, if you wanted to have a command only act on foreign cars, your If condition (more on If conditions later) would be foreign==1, not foreign=="Foreign".
Missing Values
The variable rep78 has several cells containing a dot (.) rather than a number.
 |
These are missing values: rep78 is a measure of the car's repair record, and that information was not available for several cars. It's important to be aware of missing values when you have them--forgetting about them can lead to incorrect results. We'll talk more about how missing values are treated when we discuss specific commands.
Getting Data Into Stata
If you will only be analyzing data sets which have been provided to you in Stata format you can safely skip this section. But if you're not so lucky, read on.
Converting Data From Other Formats
If you have been given a file containing the data you need but it's in the format used by some other program, Stat/Transfer can easily convert it to Stata format for you. The other program could be Excel, SPSS, SAS or one of many, many others. Stat/Transfer is available on Winstat and is very easy to use--for instructions see Using Stat/Transfer. Copying data from Excel and pasting it into the data editor usually works, but Stat/Transfer is more reliable and just as easy.
Entering Data by Hand
If you need to type in data by hand, you can do so in the data editor. However, you should define the variables first so you can choose their types yourself. If you just start typing in the data editor Stata will try to guess, but it will sometimes make mistakes like thinking a numeric variable should be a string.
To create a new variable, click Data, Create or change data, Create new variable. Type the name you want to give the new variable in the Variable name box. In Contents of the variable choose Fill with missing data--you'll type in the real values later.
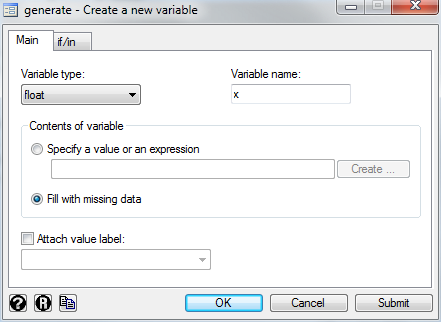
For most numeric variables the default Variable type, float, will be fine. However, very long IDs like Social Security numbers should be stored as long to ensure they aren't rounded.
To create a text variable, change the Variable type to str (string).

You can also create the exact same variables by typing the generate command (abbreviated gen). This could be substantially faster than the menus if you have many variables to create. The syntax is simply gen, then the variable type if it's anything but float, then the variable name, and finally what to set it equal to.
For numeric variables, "missing" is denoted by a period (.). Thus the command to create a float variable called x and set it to missing is:
gen x=.
"Missing" for a string is a string with nothing in it, or "" (an opening quote immediately followed by a closing quote). Thus the command to make a string (str) variable called y and set it to missing is:
gen str y=""
Once you've created all your variables, either by using the menus or by typing commands, open the data editor to type in their values. Be sure to check your work once you're done. One useful method is to get summary statistics for all your variables and make sure the means, maximums and minimums look plausible. See the section on summary statistics in Basic Statistics, Regression and Graphs for instructions.
Commands
Most Stata commands work in the same way, so before discussing the many commands you can give in Stata we'll talk about some things they have in common. In doing so we'll use a very simple Stata command as an example: list.
(These examples are written assuming you have the example automobile data loaded. If you don't already, click File, Open, and then go to C:\Program Files (x86)\Stata14 and double-click auto.dta.)
The list command simply prints the table of your data set. To get the simplest list, click Data, Describe data, List Data and click OK in the resulting window without changing anything. Alternatively, you can type list or even just l (which Stata understands as an abbreviation for list).
This gives you a great deal of information, probably more than you want. Thus it's useful to limit the command so it only lists what you want to see. This is typical in Stata: once you've chosen what you want to do (i.e. picked a command) you then need to tell Stata what you want it to act on.
Variable Lists
If you want the command to only act on certain variables, then you need to specify those variables. Click Data, Describe data, List data again, but this time type make price mpg in the Variables box.
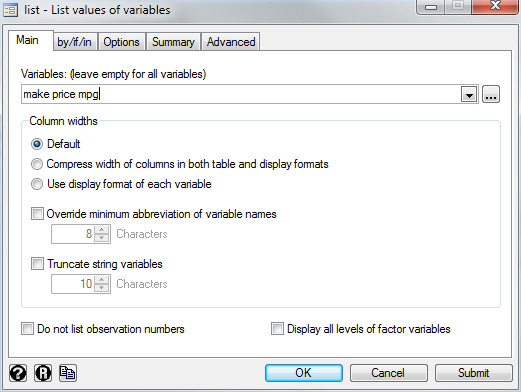
Click Submit and you'll get a listing of just the make, price and mpg of each car (while leaving the window open so you can make further changes). The equivalent command is also very simple:
list make price mpg
If Conditions
If you want the command to only act on certain observations, you need to tell Stata which observations. This takes the form of an If condition, and the command will only act on those observations where the condition is true.
Click on the by/if/in tab, and in the If: box type mpg==25. Click Submit and you'll get a listing of the make, price and mpg of just those cars that get exactly 25 miles per gallon.
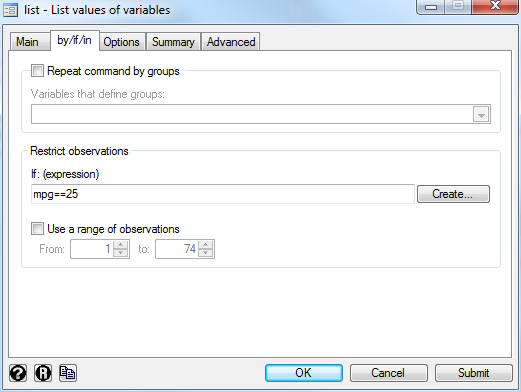
The reason you had to type two equals signs (==) between mpg and 25 is that Stata uses the equals sign for two different purposes. One equals sign is used for assignment when creating or changing variables: mpg=25 means "make mpg 25." Two equals signs are used in tests and conditions. In that form it's a question: "Is mpg equal to 25?"
Note that in the command the list of variables comes before the if condition:
list make price mpg if mpg==25
If you want to use string variables in an if condition you need to put the value you're interested in quotes:
list make mpg if make=="VW Diesel"
"Not equals" is denoted by !=. "Greater than" and "less than" use the standard symbols > and <.
You can make very complicated if conditions if you need to, including combining conditions. If you put an ampersand (&) between two conditions this is a logical "and" and the result is true if and only if both conditions are true. Logical "or" is the pipe character, (|) or Shift-Backslash, and if you put it between two conditions the result will be true if either condition is true.
Thus:
list make price mpg if mpg>25 & price<5000
will give you a list of cars that both get good gas mileage and are relatively cheap (in 1978 dollars), while:
list make price mpg if mpg>25 | price<5000
will give you a list of cars that either get good gas mileage or are relatively cheap (or both), a much larger list. If you're working with the menus, the conditions to put in the If box for the last two examples would be mpg>25 & price<5000 and mpg>25 & price<5000 respectively.
Missing values can complicate if conditions. "Missing" is stored internally as plus infinity, so if you typed:
list make rep78 if rep78>3
any car with a missing value for rep78 would be included in your list. (Imagine the results if you tried to count "people over 65" with if age>65 and had missing values for age.) If you really wanted a list of cars that are known to have good repair records, you could type:
list make rep78 if rep78>3 & rep78!=.
Recall that != means "not equals" and . means a missing value.
By Groups
By allows you to break your data up into subsamples and then run the command separately for each subsample. For example, in this data the rep78 variable is a measure of the car's repair record on a five point scale. To get a list of the cars in each category, first remove the If condition, then check the Repeat command by groups box and type or select rep78 in Variables that define groups.
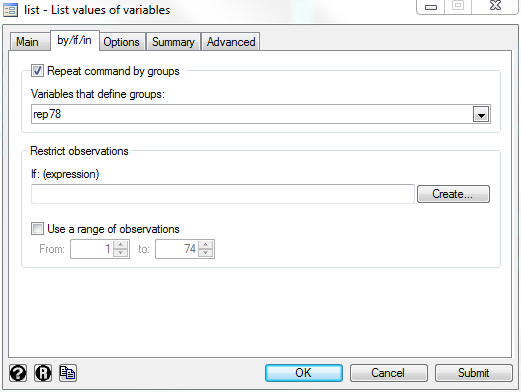
Click Submit and you'll get a separate list for each value of rep78: first the cars that got a 1, then the cars that got a 2, etc. Note that the final category is cars with a missing value for rep78.
The corresponding command is:
by rep78, sort : list make price mpg
Note how unlike variable lists and if conditions, by comes first and the command itself follows a colon (:). The sort option tell Stata to sort the data by rep78 before executing the rest of the command. You can only use by if the data are sorted by the same variable, but if your data were already sorted you could just type:
by rep78: list make price mpg
Options
Options modify how a command behaves. When typed they always follow a comma and come at the end of the command--though in the previous example the sort option came at the end of the by that it modified rather than the end of the list command. If you have multiple options they all follow a single comma rather than each one having its own.
Click on the Options tab and check the box Draw divider lines between columns. Then in the box underneath Place separators every N lines change Lines from 5 to 3.
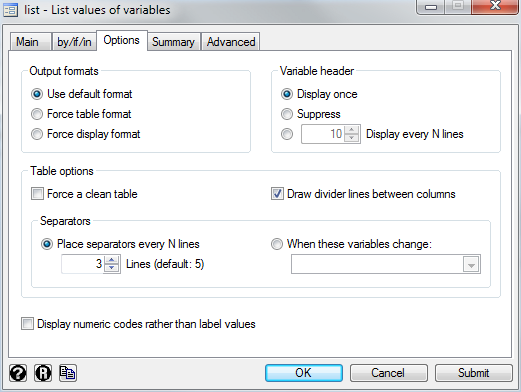
Click Submit and you'll get a more cluttered listing, but the real point is to note the command:
by rep78, sort : list make price mpg, divider separator(3)
The changes you made caused Stata to add the divider and separator() options, with the value you chose for separator placed in parentheses after it.
If you dislike these new settings you could remove them individually. However, clicking the small R button in the lower left corner of the window will reset everything to the defaults.
Creating and Modifying Variables
Creating new variables and changing the tables of your current variables goes beyond the scope of this article. But given what you now know about Stata commands, in particular about if conditions, you can easily learn to do so by reading Working with Data from the Stata for Researchers series.
Learning More
Now that you understand the basis of using Stata, you can learn how to carry out actual statistical tasks by reading Basic Statistics, Regression and Graphs.
If you're stuck, your first resource should be the help files. Click Help, Contents and you can read about a variety of basic Stata topics. If you know what command you want to use but need more information about how to use it, type help command where command should be replaced by the name of the command about which you need information. If, on the other hand, you know what you want to do but no idea what command will do it, click Help, Search and then type in some search terms (this works best for finding statistical techniques).
The SSCC also has other Stata articles available online. These are mostly oriented towards researchers doing more advanced work, but could still be useful to you. See the statistical software section of our Knowledge Base for a list.
Doug Hemken, a statistical computing specialist for the SSCC, is available to help you with homework and class projects. His hours are
Finally, for a more complete introduction at a similar level, consider reading A Gentle Introduction to Stata by Alan Acock. A copy is available in the 4218 computer lab for use in that lab--just talk to the student lab monitor--or you can buy your own copy from Stata's online bookstore.
Last Revised: 9/6/2011

| Contact Us |  RSS |
RSS |