Supporting Statistical Analysis for Research
3.2 Relationship between two continuous variables
Import the
Mroz.csvdata set.library(tidyverse)mroz_path <- file.path("..", "datasets", "Mroz.csv") mroz <- read_csv(mroz_path, guess_max = 100000, col_types = cols())Warning: Missing column names filled in: 'X1' [1]glimpse(mroz)Observations: 753 Variables: 9 $ X1 <dbl> 1, 2, 3, 4, 5, 6, 7, 8, 9, 10, 11, 12, 13, 14, 15, 16, 17... $ lfp <chr> "yes", "yes", "yes", "yes", "yes", "yes", "yes", "yes", "... $ k5 <dbl> 1, 0, 1, 0, 1, 0, 0, 0, 0, 0, 0, 0, 1, 0, 0, 0, 0, 0, 0, ... $ k618 <dbl> 0, 2, 3, 3, 2, 0, 2, 0, 2, 2, 1, 1, 2, 2, 1, 3, 2, 5, 0, ... $ age <dbl> 32, 30, 35, 34, 31, 54, 37, 54, 48, 39, 33, 42, 30, 43, 4... $ wc <chr> "no", "no", "no", "no", "yes", "no", "yes", "no", "no", "... $ hc <chr> "no", "no", "no", "no", "no", "no", "no", "no", "no", "no... $ lwg <dbl> 1.2101647, 0.3285041, 1.5141279, 0.0921151, 1.5242802, 1.... $ inc <dbl> 10.910001, 19.500000, 12.039999, 6.800000, 20.100000, 9.8...Plot
incagainstlwg.ggplot(mroz, aes(x = lwg, y = inc)) + geom_point() + theme_bw()
Plot
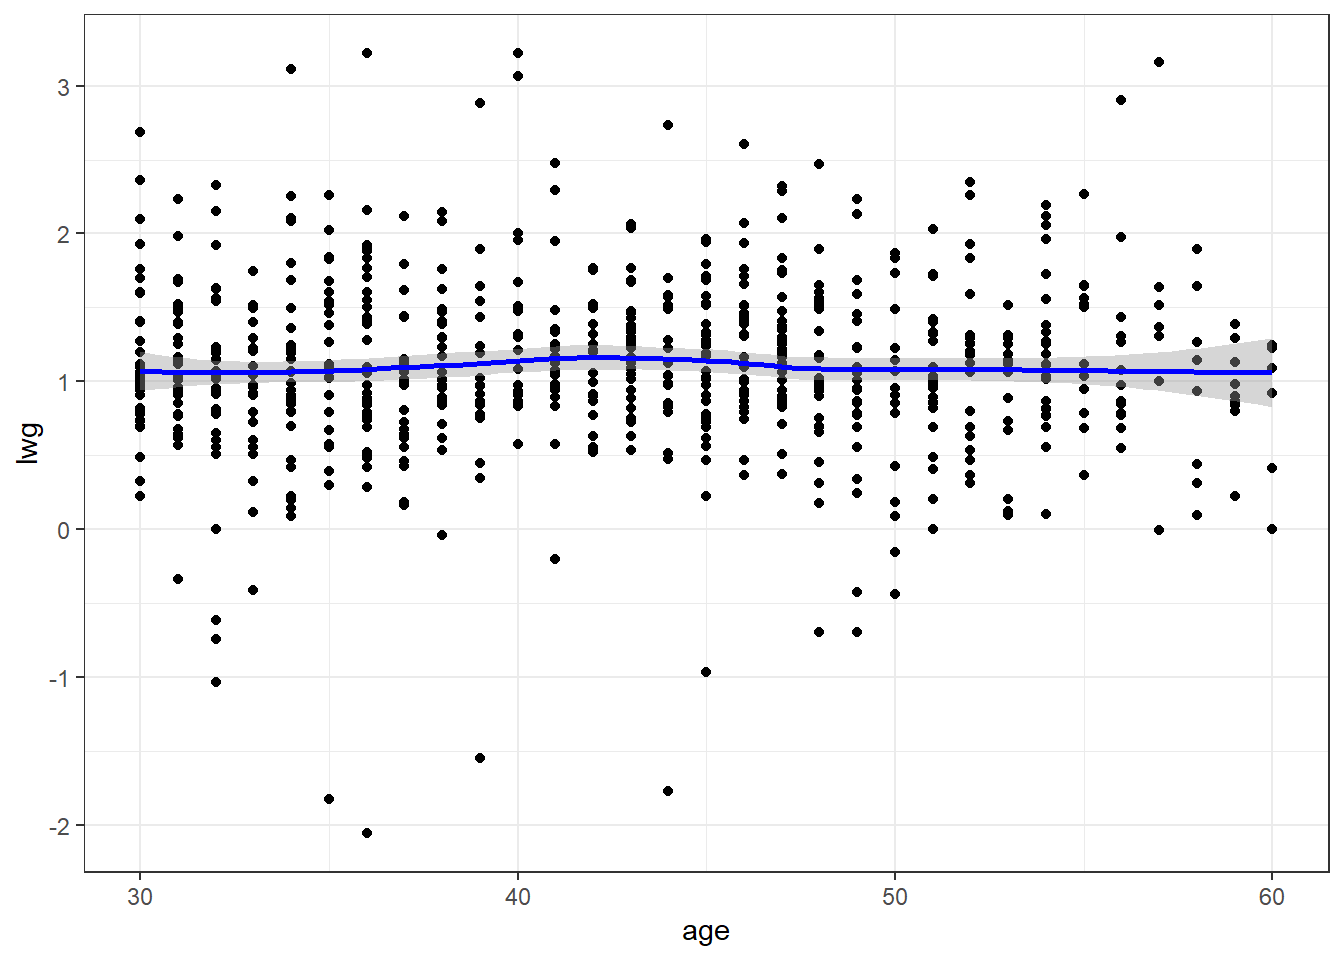
ageagainstlwg. Add a loess line to the plot.ggplot(mroz, aes(x = age, y = lwg)) + geom_point() + geom_smooth(color = "blue") + theme_bw()`geom_smooth()` using method = 'loess' and formula 'y ~ x'