 Supporting Statistical Analysis for Research
5.1 Preparatory exercises
The skills in these exercise are used in the exercises at the end of the discourses of this chapter. Take a moment and complete these to confirm that you are prepared for this chapter. If these exercises are difficult, review the prior chapters.
Import the auto.csv data set.
library(tidyverse)auto_path <- file.path("..", "datasets", "auto.csv") auto_in <- read_csv(auto_path, col_types = cols())Warning: Missing column names filled in: 'X1' [1]auto <- auto_in glimpse(auto)Observations: 392 Variables: 10 $ X1 <dbl> 1, 2, 3, 4, 5, 6, 7, 8, 9, 10, 11, 12, 13, 14, 15... $ mpg <dbl> 18, 15, 18, 16, 17, 15, 14, 14, 14, 15, 15, 14, 1... $ cylinders <dbl> 8, 8, 8, 8, 8, 8, 8, 8, 8, 8, 8, 8, 8, 8, 4, 6, 6... $ displacement <dbl> 307, 350, 318, 304, 302, 429, 454, 440, 455, 390,... $ horsepower <dbl> 130, 165, 150, 150, 140, 198, 220, 215, 225, 190,... $ weight <dbl> 3504, 3693, 3436, 3433, 3449, 4341, 4354, 4312, 4... $ acceleration <dbl> 12.0, 11.5, 11.0, 12.0, 10.5, 10.0, 9.0, 8.5, 10.... $ year <dbl> 70, 70, 70, 70, 70, 70, 70, 70, 70, 70, 70, 70, 7... $ origin <dbl> 1, 1, 1, 1, 1, 1, 1, 1, 1, 1, 1, 1, 1, 1, 3, 1, 1... $ name <chr> "chevrolet chevelle malibu", "buick skylark 320",...Is there any missing data in the
namecolumn?The data set description does not list any special missing identifiers.
The following code checks if any of the values of names were set to
NAby theread_csv()function.auto_no_name <- filter(auto, is.na(name)) auto_no_name# A tibble: 0 x 10 # ... with 10 variables: X1 <dbl>, mpg <dbl>, cylinders <dbl>, # displacement <dbl>, horsepower <dbl>, weight <dbl>, # acceleration <dbl>, year <dbl>, origin <dbl>, name <chr>There are no rows with NA in the
namecolumn.Are there any duplicated observations in the data set? Hint, look at the columns to determine what an observation is this data set.
I start with the assumption that
makeandyearuniquely identify an observation.The following code identifies any duplicate
yearandmakepairs in the auto data set.dup_rows <- duplicated(select(auto, year, name)) | duplicated(select(auto, year, name), fromLast = TRUE) dups <- filter(auto, dup_rows) select(dups, cylinders, horsepower, weight, year, name)# A tibble: 4 x 5 cylinders horsepower weight year name <dbl> <dbl> <dbl> <dbl> <chr> 1 4 83 2639 75 ford pinto 2 6 97 2984 75 ford pinto 3 4 84 2490 81 plymouth reliant 4 4 84 2385 81 plymouth reliantThere are two sets of matches. The first is for the
ford pinto. There are two different engins for the pinto. The purpose of the study would determine if these are different observations. (An observation might be defined by a uniquemake,year, andcylinders.)The second duplicates is for the
plymouth reliant. Here the engine seems to be the same with both rows have an 84 hourspower 4 cylinder engine. There is a difference in weight. It is unclear if these are different observations. It could be that there is a different trim kit for the car that accounts for the difference in wieght. It could also be from an entery error. The purpose of the study may provide some direction for these duplicates.When possible, duplicates should be reviewed with the people responsible for creating the data set. This is not always possible.
Plot the horsepower, weight, and cylinders variables.
ggplot(auto, aes(x = weight, y = horsepower)) +
  geom_point() +
  facet_wrap(~cylinders) +
  theme_bw()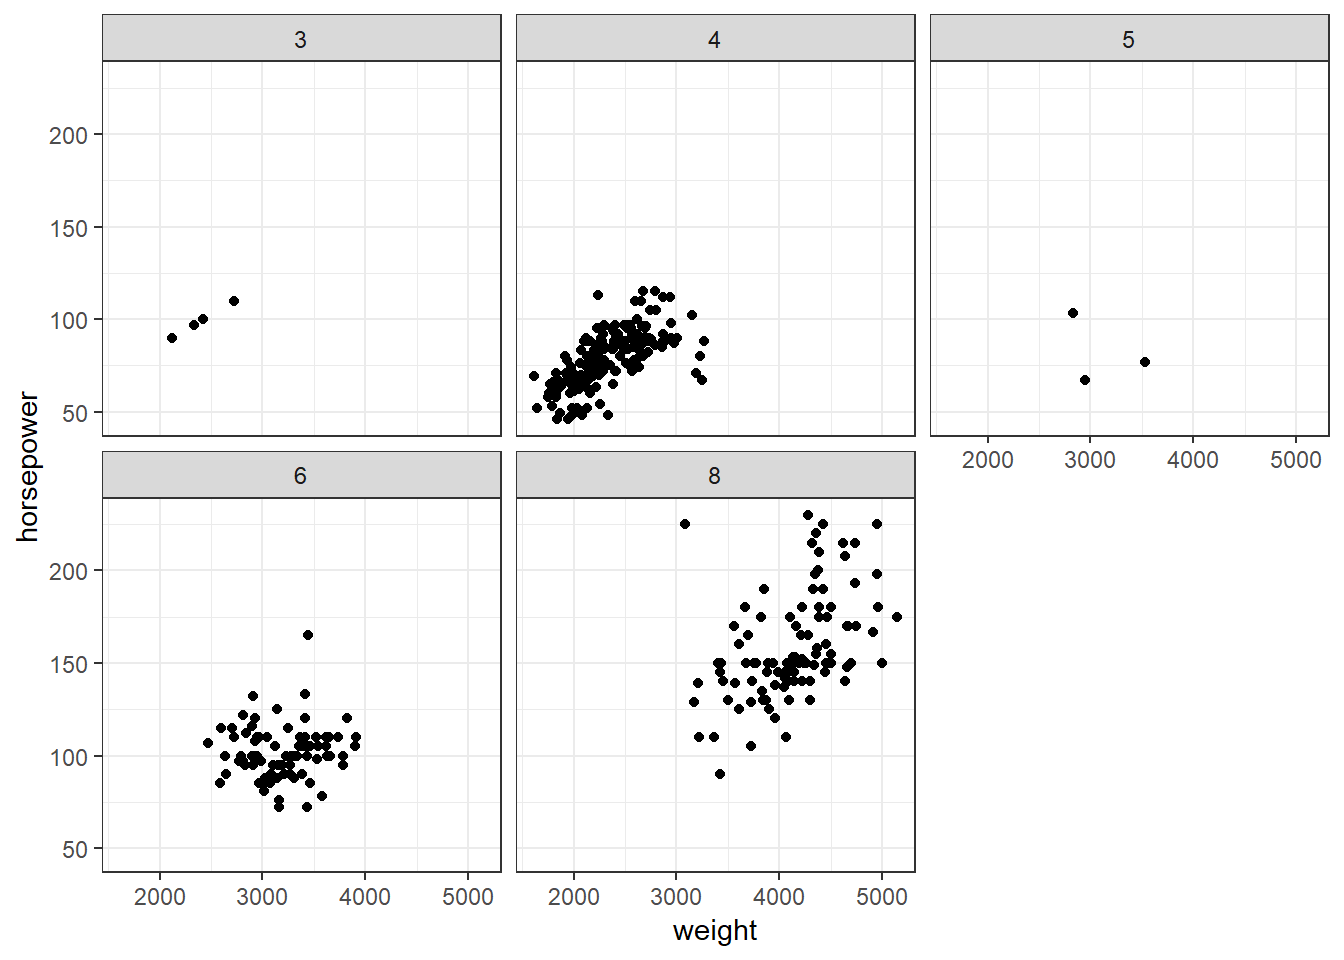
Does the plot from the prior problem show a relationship between horsepower and weight for all cylinder levels?
No. The six cylinder autos do not show a relationship between weight and horse power.