 Supporting Statistical Analysis for Research
3.10 Reshaping
Data frames may not be shaped as we need them. For example, a data frame could contain one or more variables for each year of a multi-year study. This would result in the information about year being in the variable name. This is called wide form since the repeating of the data is done with multiple columns. Alternatively the information about the year could be in a variable and the data from each of the years would be in a single set of variables. This is called long form since the repeating for the years is done through multiple rows.
Reshaping the data from wide to long or long to wide can be visualized
In the following graphic.
To go from long to wide, a variable is identified as containing the
information what the name of the repeated variable is,
here that variable is key.
Each unique value of the key variable will result in a variable of that
name in wide form.
Another variable is identified as containing the values that will be used
to construct the new variables,
here that variable is val.
The key variable has 3 unique values.
This results in key and val variables being transformed into three
new variables, A, B, and C.
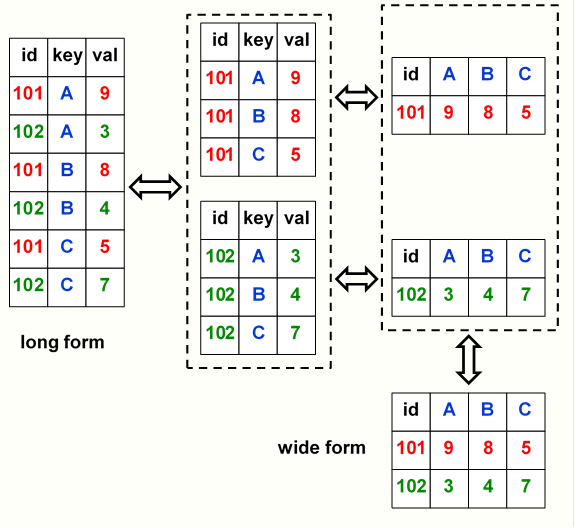
Figure 3.2: Conceptual representation of reshaping a data frame
To go from wide to long form the set of wide variables needs to be
identified,
here that would be, A, B, and C.
Two new variables will be created from these wide variables.
One of these two new variables will contain the names of the
of the wide variables,
here this is the key variable.
The other new variable will contain the values from the wide
variables,
here this is the val variable.
The values of the key variable tell us which wide variable the
val values are from.
For example,
in the first data row of the long form the A in key tells us that
9 is from the A variable.
Examples
Reshaping to wide
nafta_industries_tbl <-
  nafta_industries %>%
  spread(key = industry, value = mean)

nafta_industries_tbl
# A tibble: 2 x 5 # Groups: nafta [2] nafta finance oil_gas other tech <lgl> <dbl> <dbl> <dbl> <dbl> 1 FALSE 8.23 23.4 8.80 19.8 2 TRUE 14.1 17.1 11.7 30.9Reshaping to long
  nafta_industries_tbl %>%
  gather(
    key = industry,
    value = mean,
    finance, oil_gas, other,  tech
    )
# A tibble: 8 x 3 # Groups: nafta [2] nafta industry mean <lgl> <chr> <dbl> 1 FALSE finance 8.23 2 TRUE finance 14.1 3 FALSE oil_gas 23.4 4 TRUE oil_gas 17.1 5 FALSE other 8.80 6 TRUE other 11.7 7 FALSE tech 19.8 8 TRUE tech 30.9