Supporting Statistical Analysis for Research
4.5 Diagnostics
A few basic diagnostics are provided in this article. A more complete coverage of diagnostics can be found in the Regression Diagnostics article.
The plot() function provided a set of diagnostic
plots for model objects.
Syntax and use of the
plot()function for model objects.plot(modObj, which=plotId)
There is no returned object. Diagnostics plots are generated by this function.
plotId can take values from 1 through 6. The three plots we will examine are, 1 for a residual plot, 2 for the normal q-q of residuals, and 5 for the residual versus leverage plots. The default for plotId is c(1,2,3,5). When there are multiple plots produced from one call to plot, you will be prompted in the console pane to hit enter for each of these plots. This is to allow you time to view and possibly save each plot before the next plot is displayed.
This set of prepared diagnostic plots provides an initial look at all the major model assumptions and is a good place to start the evaluation of the fit of a model.
The following example produces the residual, normality, and leverage plots for the OLS model.
Creating a residual plot.
plot(mod, which = 1)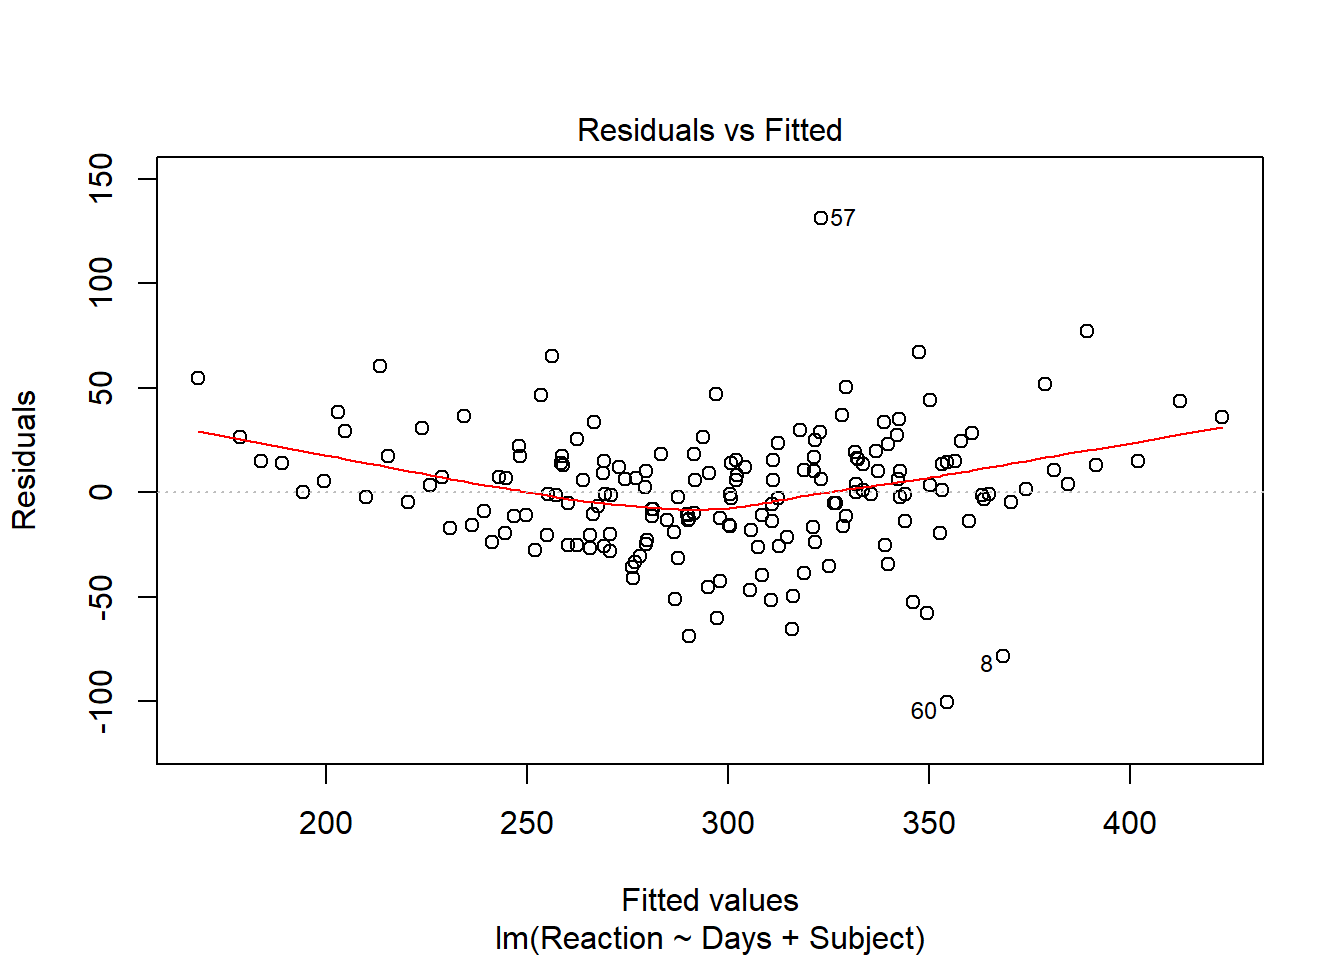
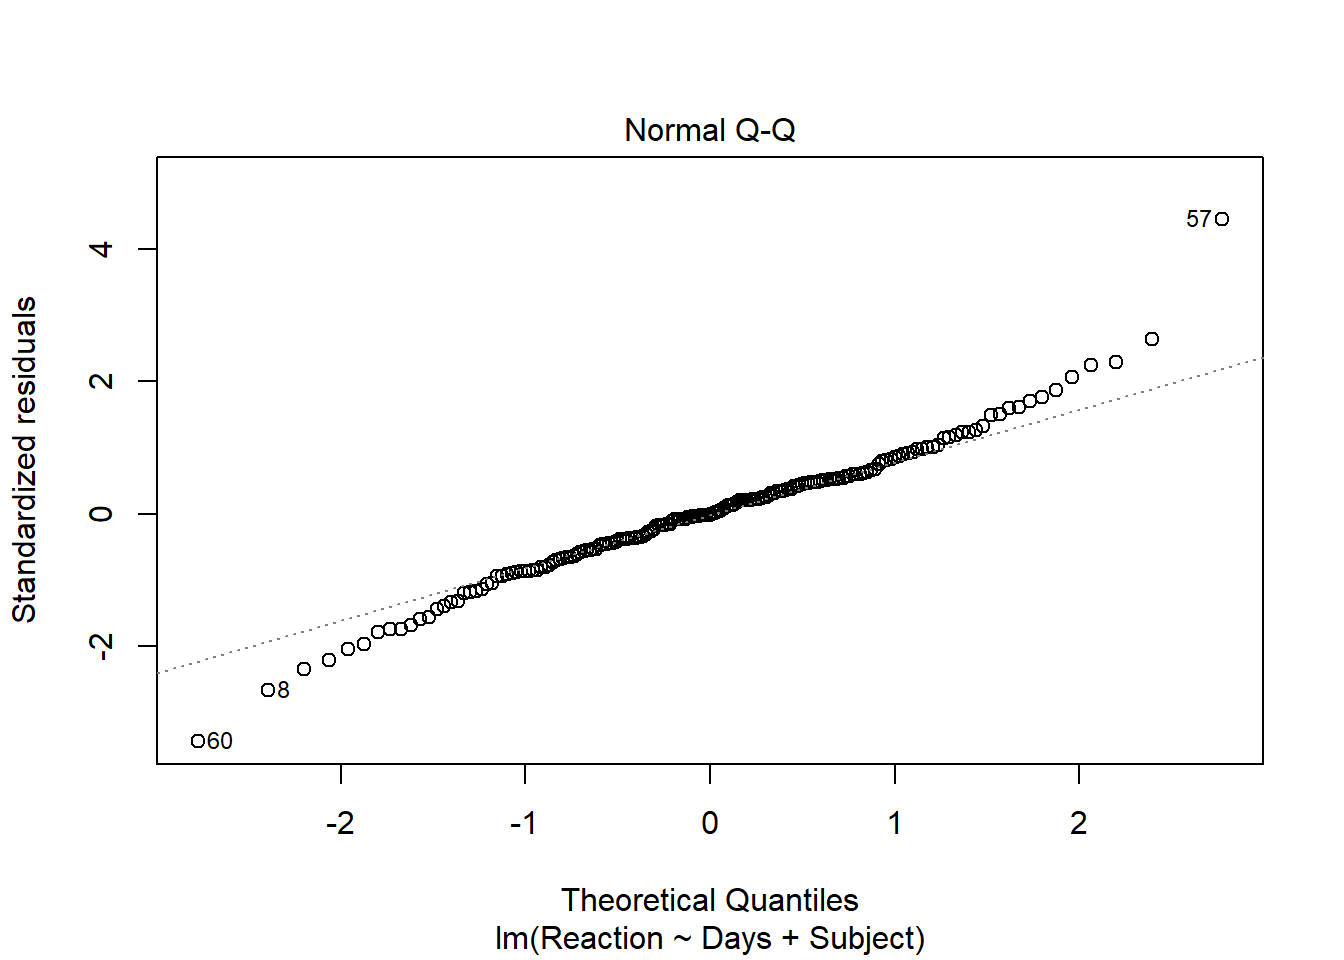
Creating a normal q-q plot.
A q-q plot is a plot of the emperical quantiles to the theoritical quantiles.
plot(mod, which = 2)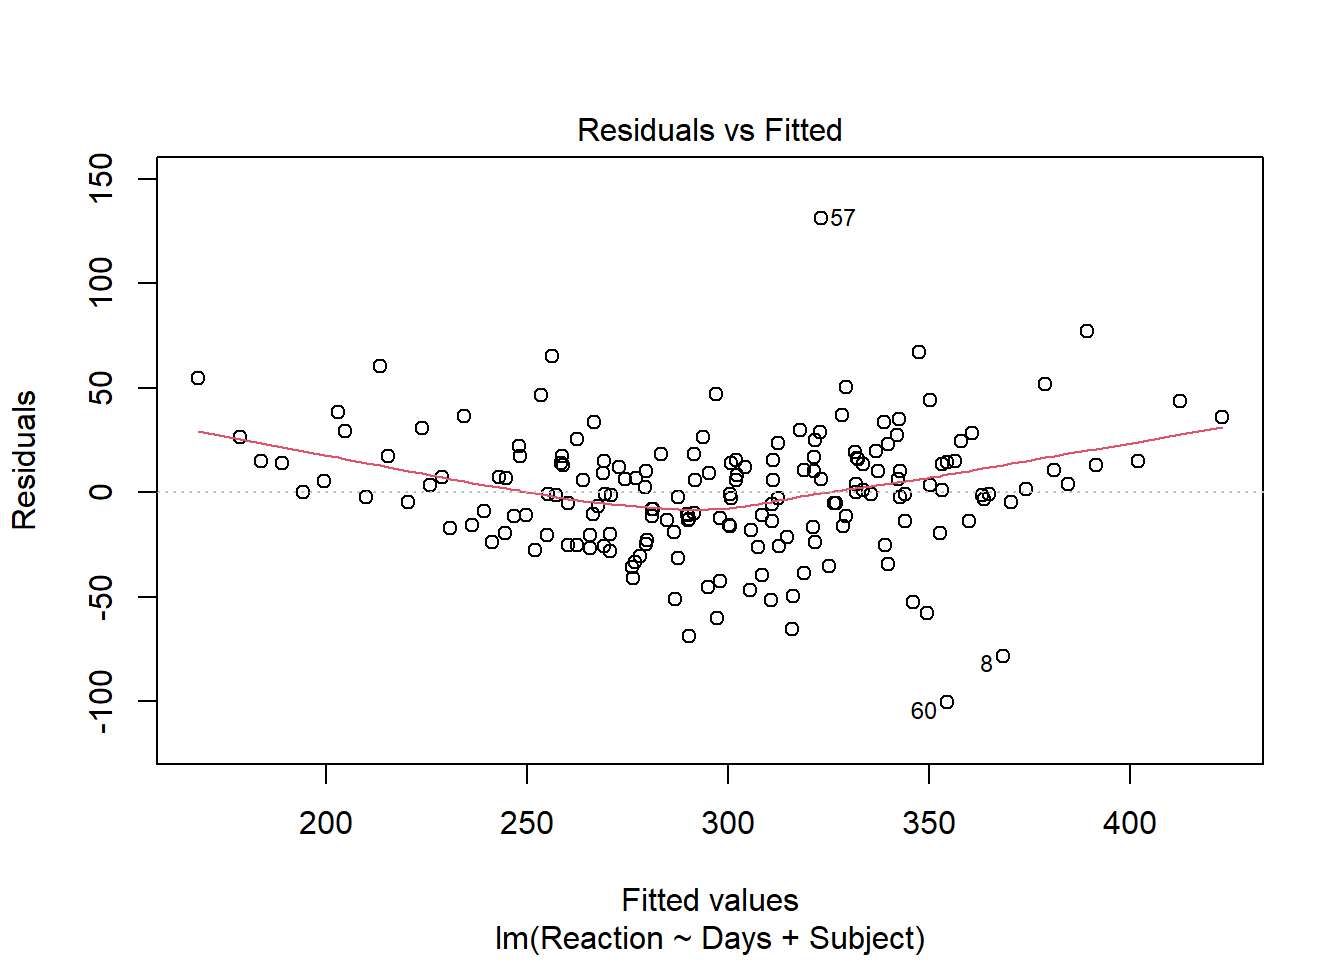
Creating a leverage and influence plot.
plot(mod, which = 5)