| id | year | income |
|---|---|---|
| 32 | 2000 | 42000 |
| 32 | 2001 | 43000 |
| 32 | 2002 | 49000 |
| 32 | 2003 | 50000 |
| 38 | 2002 | 36000 |
| 38 | 2003 | 36000 |
| 39 | 2001 | 18000 |
| 39 | 2002 | 18500 |
| 42 | 2000 | 76000 |
| year | income_adj |
|---|---|
| 2000 | 1.53 |
| 2001 | 1.47 |
| 2002 | 1.46 |
| 2003 | 1.42 |
| person_id | state |
|---|---|
| 30 | MN |
| 32 | WI |
| 38 | IA |
| 39 | WI |
Imagine you have been tasked with combining these three tables into one. You do not need to actually combine them just yet. We will learn the R code below, and one of the extended exercises will revisit this warm-up.
For now, just discuss the decisions you would have to make: which variables correspond to one another and how to associate values from one dataset with another.
| id | year | income |
|---|---|---|
| 32 | 2000 | 42000 |
| 32 | 2001 | 43000 |
| 32 | 2002 | 49000 |
| 32 | 2003 | 50000 |
| 38 | 2002 | 36000 |
| 38 | 2003 | 36000 |
| 39 | 2001 | 18000 |
| 39 | 2002 | 18500 |
| 42 | 2000 | 76000 |
| year | income_adj |
|---|---|
| 2000 | 1.53 |
| 2001 | 1.47 |
| 2002 | 1.46 |
| 2003 | 1.42 |
| person_id | state |
|---|---|
| 30 | MN |
| 32 | WI |
| 38 | IA |
| 39 | WI |
Objective: To combine two or more datasets into a single dataset.
Why it matters: Data for your research question may be spread across multiple datasets, and it is necessary to first consolidate all the data in order to model and visualize it.
Learning outcomes:
| Fundamental Skills | Extended Skills |
|
|
Key functions and operators:
full_join()
inner_join()
left_join()
right_join()
bind_rows()Merging is the process of combining multiple datasets into a single dataset. Examples include adding inflation factors to panel data to adjust income to today’s rates, or adding county-level statistics to individual-level data. We will consider two types of merges: adding columns from one dataset to another, and adding rows (which is also called appending).
Load the tidyverse for merging functions:
library(tidyverse)The actual act of merging two datasets usually only involves one or two lines of code. Most of the work when merging happens before this, in preparing dataframes for merging and in deciding which rows we want in the output.
First, create two subsets of airquality that differ in their variables and rows:
air5to8 <-
  airquality |>
  select(Month, Day, Temp) |>
  filter(Month %in% 5:8,
         Day %in% 1:2)

air6to9 <-
  airquality |>
  select(-Temp) |>
  filter(Month %in% 6:9,
         Day %in% 1:2)
As suggested by their names, air5to8 only has May-August, while air6to9 has June-September. Both datasets only have the first two days of each month for space reasons.
As for their variables, both have Month and Day. In addition to these, air5to8 only has Temp while air6to9 has Ozone, Solar.R, and Wind.
The goal is to combine these two datasets into a single dataset for later modeling and visualization.
To combine them together, we need a key, an identifier that we can use to match one set of information to another. A key can be any variable or combination of variables that can be used to link information across datasets, such as a participant ID, a county name, or a combination of country and year.
Here, the key is the combination of two variables, Month and Day.
To merge two datasets together, the key columns must have the same name, and any columns that have the same name across the two datasets must have the same meaning. If either is not true, simply rename() columns before merging.
For example, if one dataset had Month and Day while the other had month and day, we would change the case of either one to match the other. For the other situation where variables have the same name but different meanings, we would need to change the name of one of these to something else, or else R would be unable to link observations. An example of this would be if one dataset’s Day variable was the numeric day of the month, while the other dataset’s Day variable was the character or factor day of the week.
After the datasets’ column names are appropriately named, the next matter is deciding which rows we want to appear in the merged dataset.
Both air5to8 and air6to9 have months 6-8, and either dataset has an additional month; air5to8 has month 5 and air6to9 has month 9. We have four choices for which months we want to appear in our merged dataset:
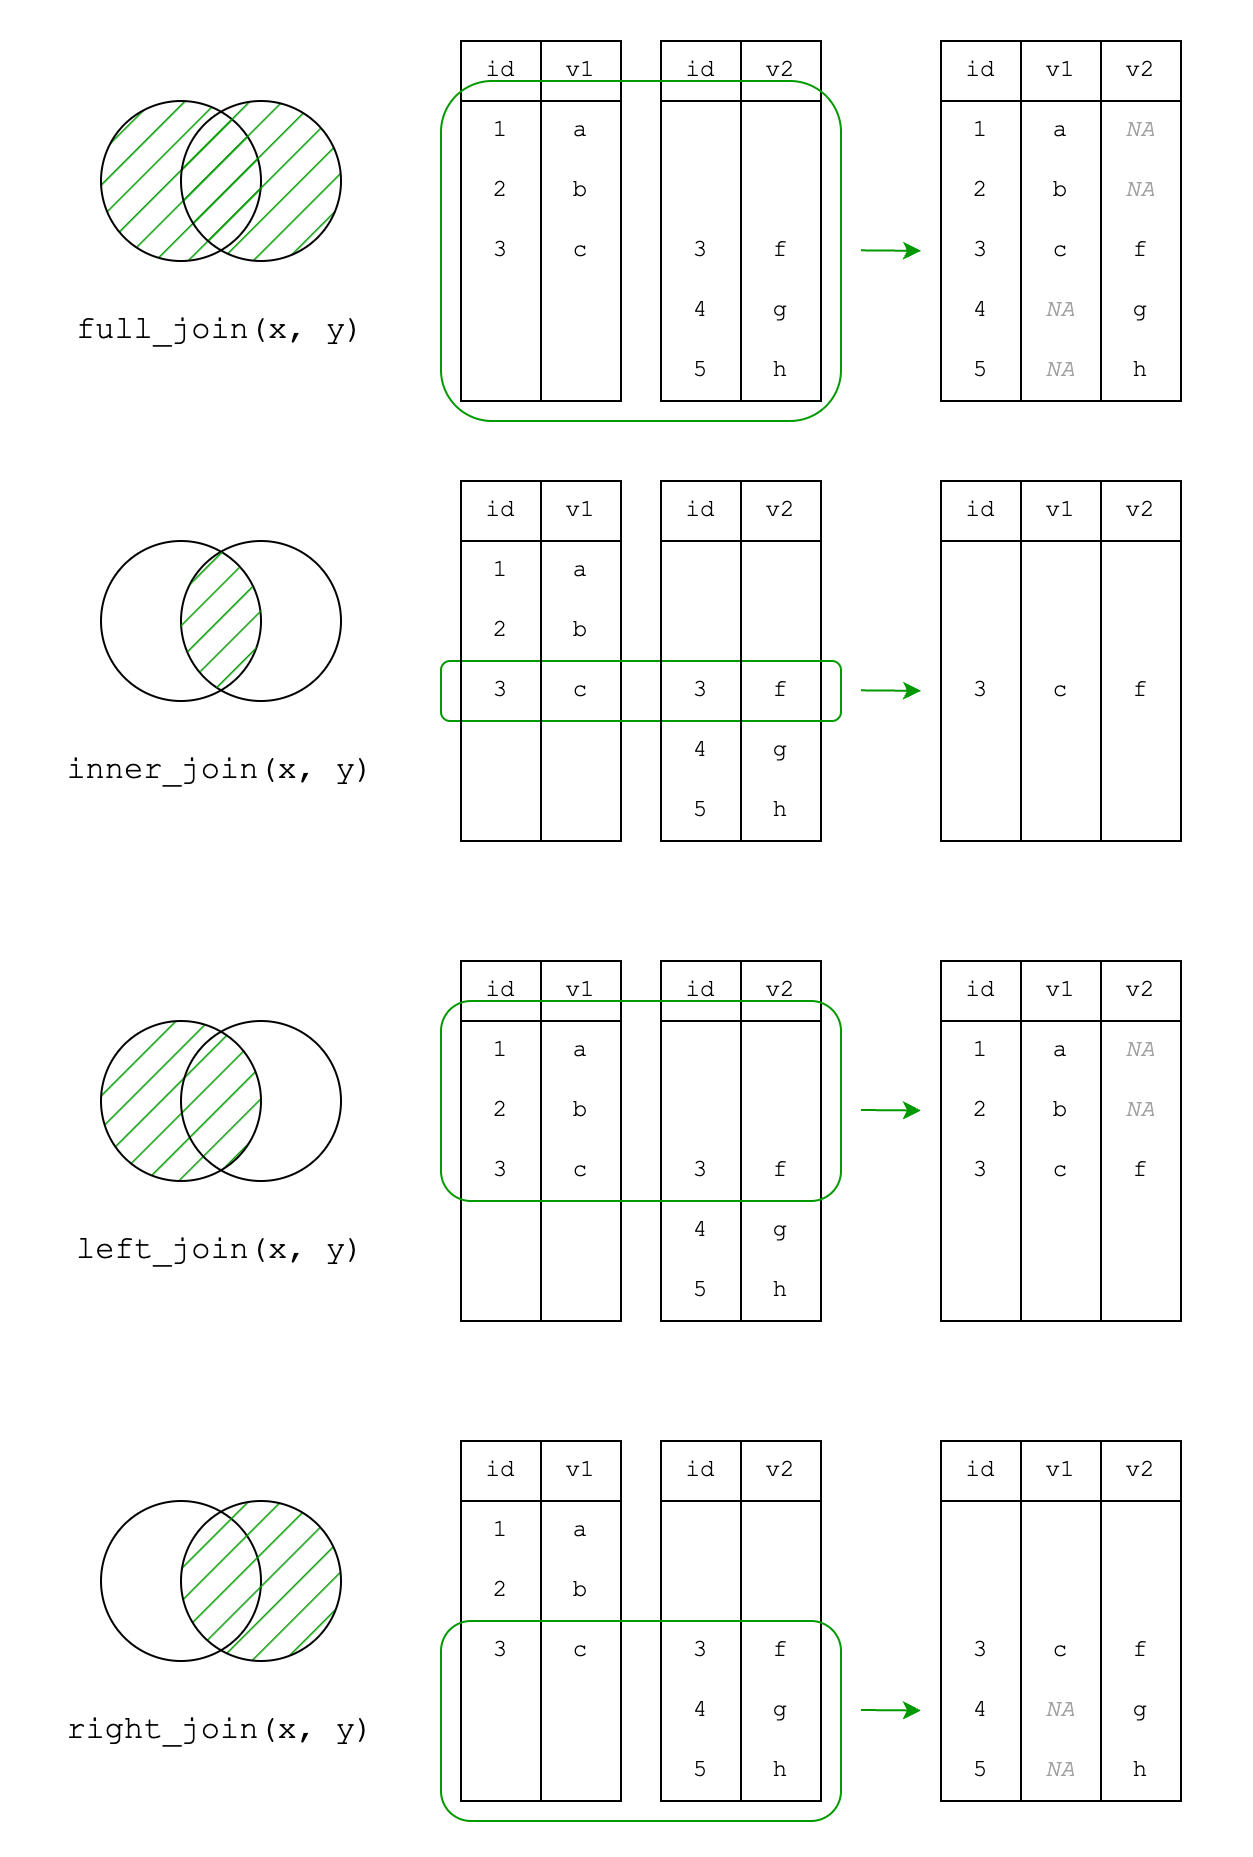
air_5to8)air_6to9)Choice 1 returns all observations. This is done with full_join(), and this should be your default when merging datasets.
full_join(air5to8, air6to9)Joining with `by = join_by(Month, Day)` Month Day Temp Ozone Solar.R Wind
1 5 1 67 NA NA NA
2 5 2 72 NA NA NA
3 6 1 78 NA 286 8.6
4 6 2 74 NA 287 9.7
5 7 1 84 135 269 4.1
6 7 2 85 49 248 9.2
7 8 1 81 39 83 6.9
8 8 2 81 9 24 13.8
9 9 1 NA 96 167 6.9
10 9 2 NA 78 197 5.1Observations were matched by a combination of Month and Day. Wherever no data existed for some combination, such as Wind for May 1-2 or Temp for September 1-2, NA values are filled in.
Choice 2 only returns observations that exist in both datasets. This is done with inner_join(). This function silently drops data, so only use it if you are sure you want to exclude observations. You can always first use full_join() and then later filter() the dataset.
inner_join(air5to8, air6to9)Joining with `by = join_by(Month, Day)` Month Day Temp Ozone Solar.R Wind
1 6 1 78 NA 286 8.6
2 6 2 74 NA 287 9.7
3 7 1 84 135 269 4.1
4 7 2 85 49 248 9.2
5 8 1 81 39 83 6.9
6 8 2 81 9 24 13.8Choices 3 and 4 use one dataset to filter the other. left_join() uses the “left” dataset (first argument) to filter the second, while right_join() uses the “right” dataset (second argument) to filter the first. They are essentially the same function, and the choice between the two is just for convenience when piping, since the pipe inserts the previous expression as the first (left) argument.
left_join(air5to8, air6to9)Joining with `by = join_by(Month, Day)` Month Day Temp Ozone Solar.R Wind
1 5 1 67 NA NA NA
2 5 2 72 NA NA NA
3 6 1 78 NA 286 8.6
4 6 2 74 NA 287 9.7
5 7 1 84 135 269 4.1
6 7 2 85 49 248 9.2
7 8 1 81 39 83 6.9
8 8 2 81 9 24 13.8right_join(air5to8, air6to9)Joining with `by = join_by(Month, Day)` Month Day Temp Ozone Solar.R Wind
1 6 1 78 NA 286 8.6
2 6 2 74 NA 287 9.7
3 7 1 84 135 269 4.1
4 7 2 85 49 248 9.2
5 8 1 81 39 83 6.9
6 8 2 81 9 24 13.8
7 9 1 NA 96 167 6.9
8 9 2 NA 78 197 5.1A use case for these functions is when combining two datasets that differ in their scope. You may have one dataset with information about Wisconsin schools that has a variable with the county each school is in. You then download a dataset from the Census with county-level characteristics for every county in the United States. In merging these, you would use a left or right join to only keep counties in Wisconsin since you do not need counties from other states.
The difference between the four types of joins is illustrated in the graphic below:
The merging functions can only take two datasets as a time, so merging more than two datasets requires a multi-step merge, or use of the reduce() function from purrr.
The bind_rows() function takes the names of two or more dataframes, which it “stacks” on top of each other. bind_rows() automatically matches columns by name, so the datasets can differ in their number and order of columns.
Create more subsets of airquality to then append them to one another. air1, air2, and air3 each have two days of a single month, and all but one of the air quality measurements.
air1 <-
  airquality |>
  filter(Month == 5,
         Day %in% 1:2) |>
  select(-Ozone)

air2 <-
  airquality |>
  filter(Month == 6,
         Day %in% 1:2) |>
  select(-Wind)

air3 <-
  airquality |>
  filter(Month == 7,
         Day %in% 1:2) |>
  select(-Temp)
The same issue with column names when merging also applies when appending. If columns mean the same thing, they should have the same name. If they mean different things, they should have different names.
bind_rows(air1, air2, air3) Solar.R Wind Temp Month Day Ozone
1 190 7.4 67 5 1 NA
2 118 8.0 72 5 2 NA
3 286 NA 78 6 1 NA
4 287 NA 74 6 2 NA
5 269 4.1 NA 7 1 135
6 248 9.2 NA 7 2 49A common situation where you will need to append dataframes is when combining multi-year data stored in separate files, such as American Community Survey data from multiple years (like the 2000 data in a previous chapter).
bind_rows() is picky about matching column types, and it will not automatically coerce columns to be of the same type. Instead, it will return an error. We can fix this by manually coercing column types to character before merging.
First, create some sample data. Imagine we just received two sets of survey data.
survey1 <-
  data.frame(Q1 = c(1, 1),
             Q2 = c(3, 1),
             Q2a = c("Sometimes", NA),
             Q3 = c(6, 7),
             Q3a = c("Never", "Always"))

survey2 <-
  data.frame(Q1 = c(2, 4, 4),
             Q2 = c(1, 5, 3),
             Q2a = c(NA, NA, 2),
             Q3 = c(4, 2, 5),
             Q3a = c(NA, NA, NA))

survey1
Q1 Q2 Q2a Q3 Q3a
1 1 3 Sometimes 6 Never
2 1 1 <NA> 7 Alwayssurvey2 Q1 Q2 Q2a Q3 Q3a
1 2 1 NA 4 NA
2 4 5 NA 2 NA
3 4 3 2 5 NAWhen we use bind_rows() for survey1 and survey2, the error message tells us that column Q2a is character in one dataframe and numeric in the other.
bind_rows(survey1, survey2)Error in `bind_rows()`:
! Can't combine `..1$Q2a` <character> and `..2$Q2a` <double>.This happened here because c() automatically assigned a type based on the values it observed. When we read in datasets, read.csv() and related functions will also use the values to determine the type. Differences in responses between two datasets, especially for open-response questions, can lead to different types assigned to the two datasets’ columns.
To fix this, simply coerce the problem column in one dataset to match the type of that column in the other dataset. Then, use bind_rows().
survey2b <-
  survey2 |>
  mutate(Q2a = as.character(Q2a))

surveys <- bind_rows(survey1, survey2b)

surveys
Q1 Q2 Q2a Q3 Q3a
1 1 3 Sometimes 6 Never
2 1 1 <NA> 7 Always
3 2 1 <NA> 4 <NA>
4 4 5 <NA> 2 <NA>
5 4 3 2 5 <NA>This works well enough if we have only one or two type conflicts, but what if we have many?
We could simplify the coercion process by coercing every column to character, appending the datasets, and then asking R to reinterpret the column types. The drawback of this approach is that factors will be coerced to character and their levels will revert to alphabetical order, and list-columns may be rendered unusable.
To coerce each column in a dataframe to character, use across() to apply a function to all columns. Here, we can apply the function as.character (without trailing parentheses):
survey1 <-
  survey1 |>
  mutate(across(.cols = everything(),
                .fns = as.character))

survey2 <-
  survey2 |>
  mutate(across(.cols = everything(),
                .fns = as.character))
Then, append the datasets:
surveys <- bind_rows(survey1, survey2)

surveys
Q1 Q2 Q2a Q3 Q3a
1 1 3 Sometimes 6 Never
2 1 1 <NA> 7 Always
3 2 1 <NA> 4 <NA>
4 4 5 <NA> 2 <NA>
5 4 3 2 5 <NA>Since every column is a character, we cannot use functions that take numeric arguments, like mean():
mean(surveys$Q1)Warning in mean.default(surveys$Q1): argument is not numeric or logical:
returning NA[1] NAColumn Q1 contains only numbers, so it should be of type numeric. R can quickly reinterpret each column’s type with the type_convert() function, which essentially does what happens when importing a CSV, where R guesses each column’s type from its values. When we use this function, R will let us know which type it chose for each column.
surveys <- type_convert(surveys)
── Column specification ────────────────────────────────────────────────────────
cols(
  Q1 = col_double(),
  Q2 = col_double(),
  Q2a = col_character(),
  Q3 = col_double(),
  Q3a = col_character()
)
Now we can calculate the mean() of Q1:
mean(surveys$Q1)[1] 2.4Sometimes you need to make a small dataframe in R that you then combine with a larger dataset. The code below makes a dataframe called island_coord that contains island names and their coordinates according to Wikipedia. Merge it with penguins.
island_coord <-
  tribble(
    ~island, ~coordinates,
    "Biscoe", "65°26′S 65°30′W",
    "Dream", "64°44′S 64°14′W",
    "Torgersen", "64°46′S 64°5′W"
  )
Some datasets have information in their name or file name that is not present in the data, which is then lost when importing or combining datasets. The built-in beaver1 and beaver2 are examples of this. Add a variable specifying the beaver number (1 or 2) and then append the rows of one to the other.
Read in the three datasets shown in the warm-up exercises, and merge them into a single dataset.
merge1 <- read.csv("https://sscc.wisc.edu/sscc/pubs/dwr/data/merge_extended1.csv")
merge2 <- read.csv("https://sscc.wisc.edu/sscc/pubs/dwr/data/merge_extended2.csv")
merge3 <- read.csv("https://sscc.wisc.edu/sscc/pubs/dwr/data/merge_extended3.csv")
Append dat2 to dat1.
dat1 <-
  data.frame(id = letters[1:13],
             score = rnorm(13, 100, 15))

dat2 <-
  data.frame(id = letters[14:26],
             score = c(rnorm(12, 100, 15), "missing"))