Supporting Statistical Analysis for Research
3.2 Relationship between two continuous variables
Import the
Mroz.csvdata set.from pathlib import Path import pandas as pd import plotnine as p9mroz_path = Path('..') / 'datasets' / 'Mroz.csv' mroz = pd.read_csv(mroz_path) print(mroz.dtypes)Unnamed: 0 int64 lfp object k5 int64 k618 int64 age int64 wc object hc object lwg float64 inc float64 dtype: object
3.2.0.1 Exploring - Scatter plots
Plot
incagainstlwg.print( p9.ggplot(mroz, p9.aes(x='lwg', y='inc')) + p9.geom_point() + p9.theme_bw())<ggplot: (143589751830)>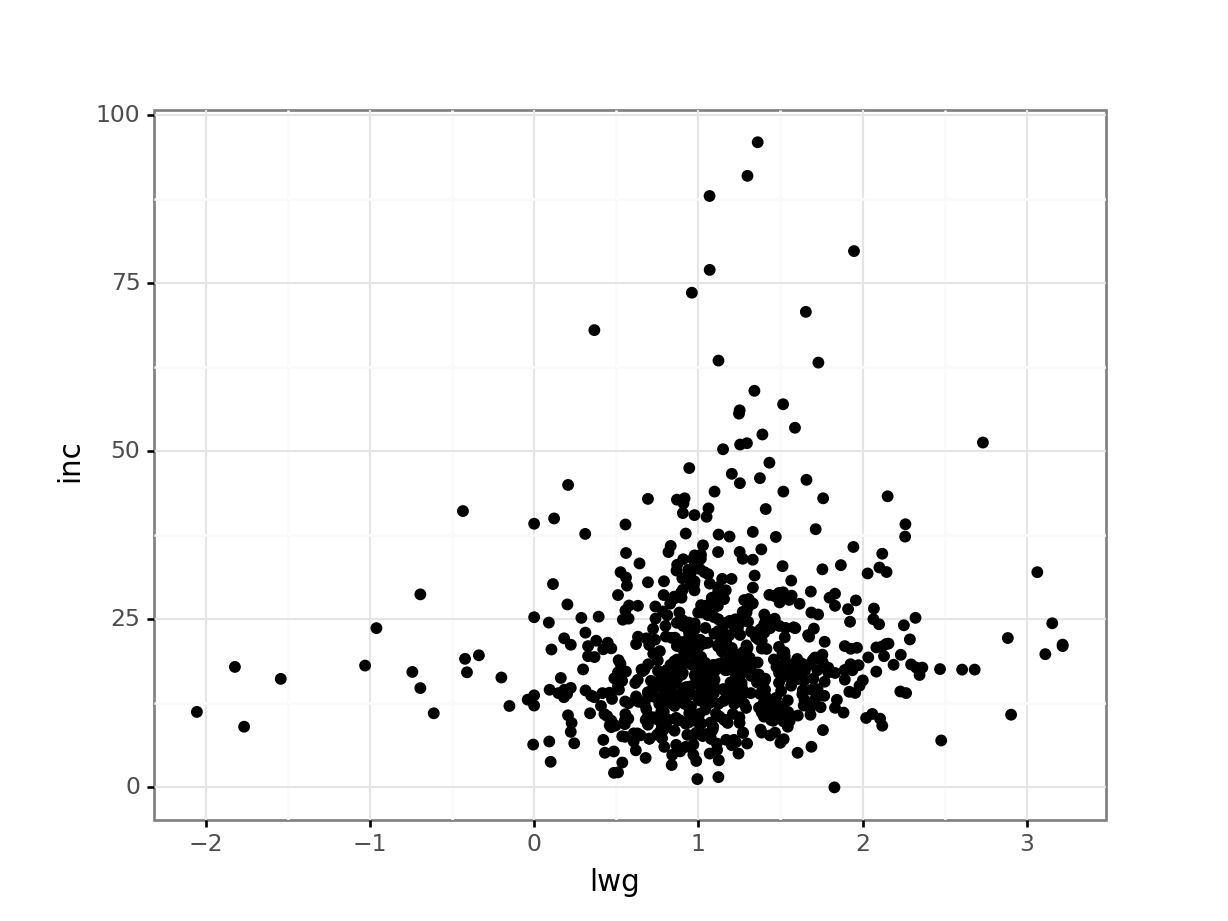
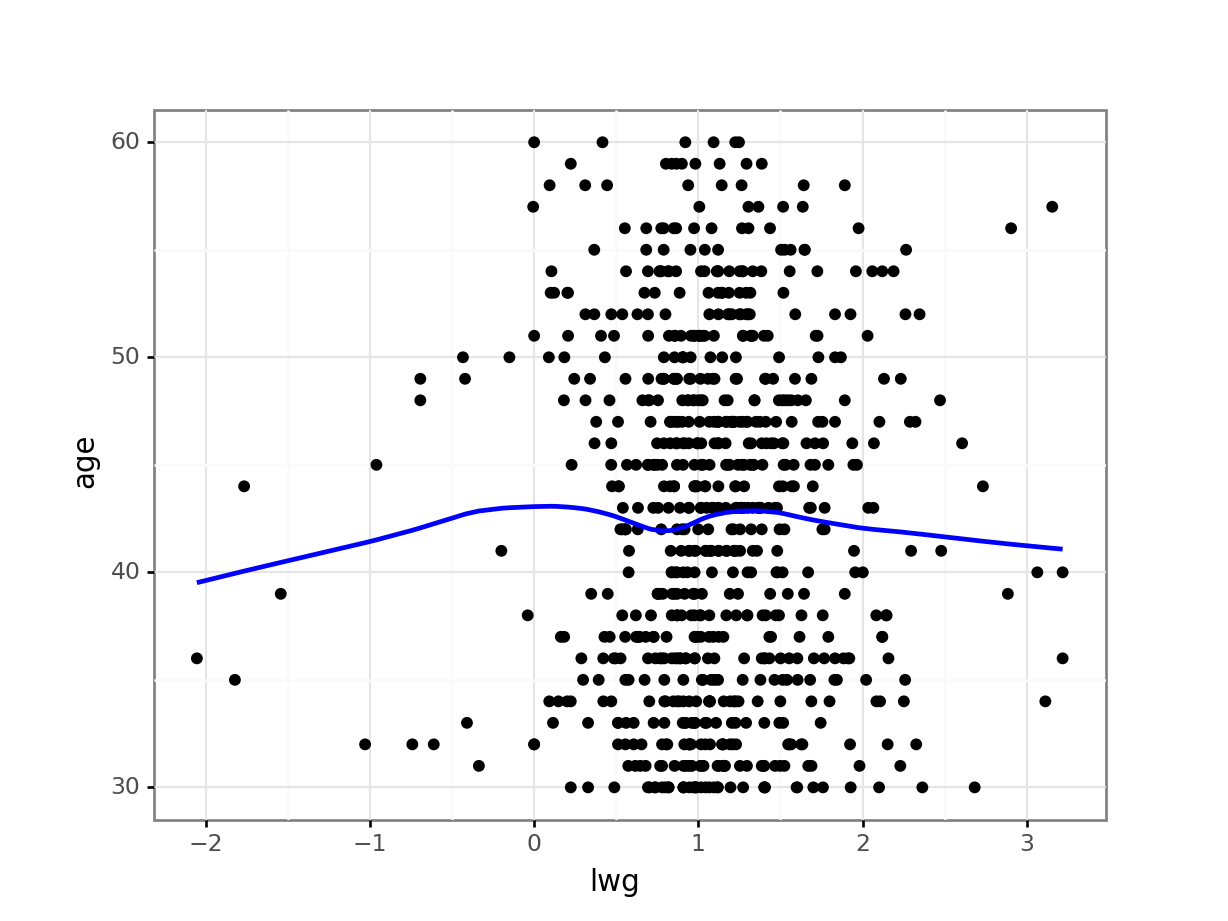
Plot
ageagainstlwg. Add a loess line to the plot.print( p9.ggplot(mroz, p9.aes(x='lwg', y='age')) + p9.geom_point() + p9.geom_smooth(color='blue') + p9.theme_bw())<ggplot: (-9223371893264592275)> C:\PROGRA~3\ANACON~1\lib\site-packages\plotnine\stats\smoothers.py:146: UserWarning: Confidence intervals are not yet implementedfor lowess smoothings. warnings.warn("Confidence intervals are not yet implemented"