Supporting Statistical Analysis for Research
3.3 Relationships between continuous and categorical variables
These exercises use the Mroz.csv data set
that was imported in the prior section.
Import the
Mroz.csvdata set.from pathlib import Path import pandas as pd import plotnine as p9mroz_path = Path('..') / 'datasets' / 'Mroz.csv' mroz = pd.read_csv(mroz_path) print(mroz.dtypes)Unnamed: 0 int64 lfp object k5 int64 k618 int64 age int64 wc object hc object lwg float64 inc float64 dtype: objectCreate a boxplot for
lwgfor women who attended college and women who did not.print( p9.ggplot(mroz, p9.aes(x='wc', y='lwg')) + p9.geom_boxplot() + p9.theme_bw())<ggplot: (143590674959)>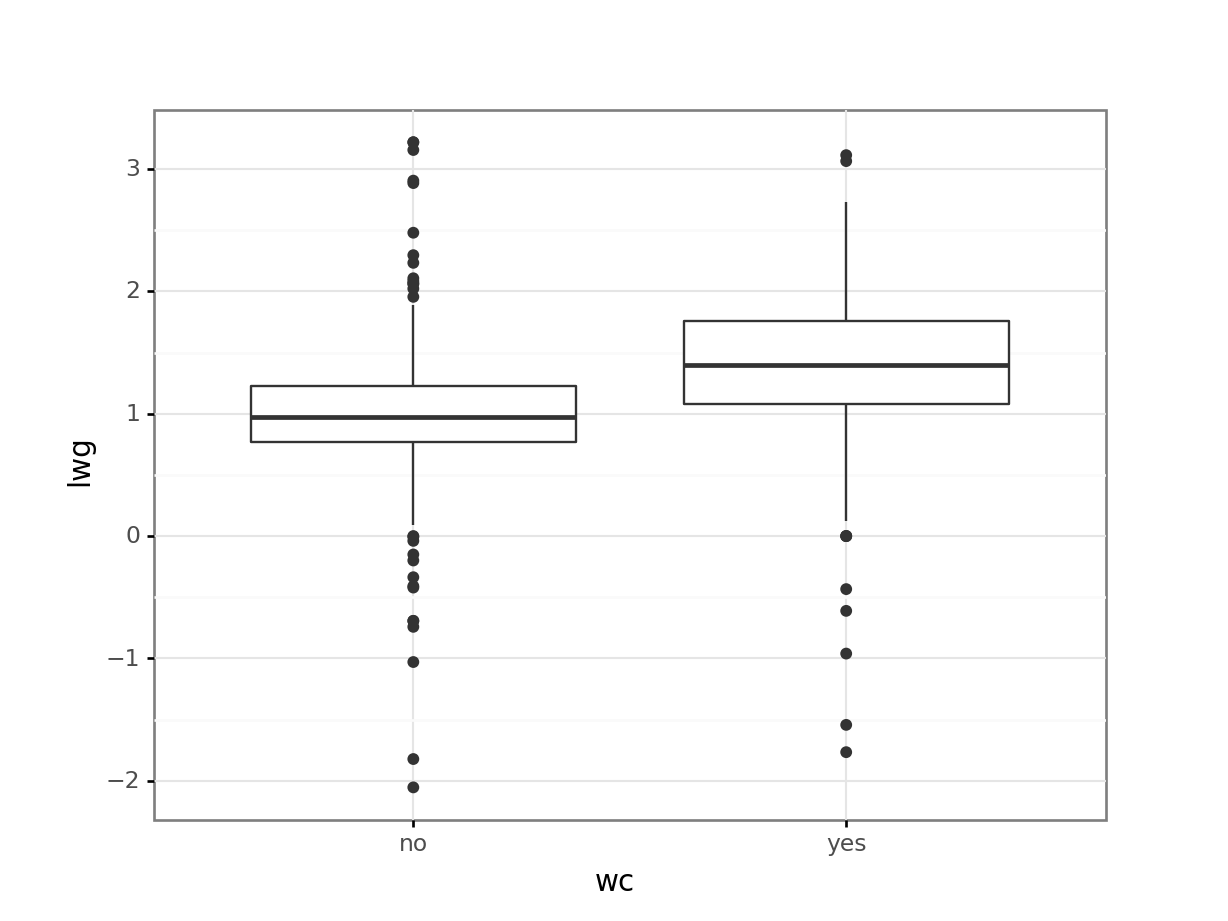
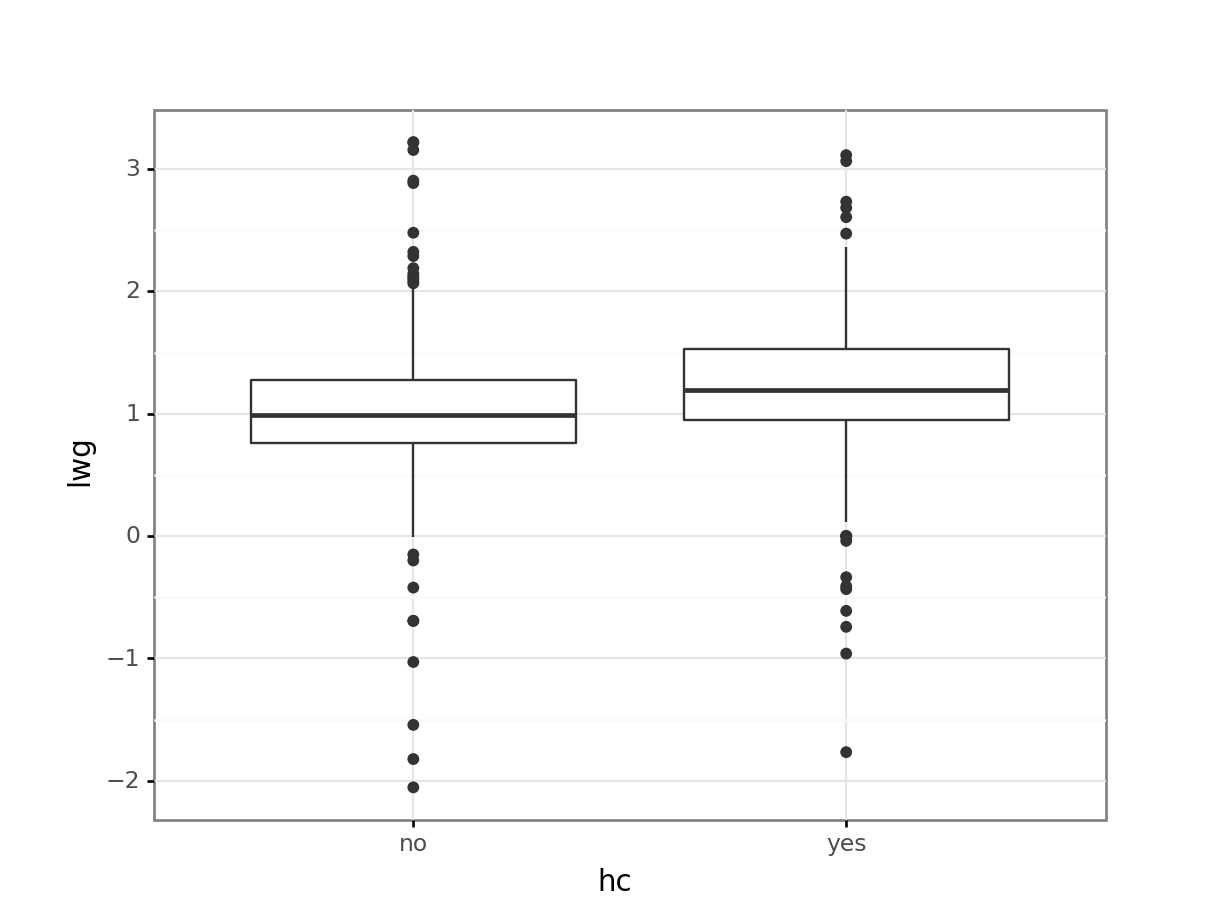
Create a boxplot for
lwgfor men who attended college and men who did not.print( p9.ggplot(mroz, p9.aes(x='hc', y='lwg')) + p9.geom_boxplot() + p9.theme_bw())<ggplot: (143590107859)>